Visualize air-Q sensor values with Smart Widgets
Present the air quality and air components in your rooms with a high occupancy density: for example in practice rooms and waiting rooms, offices, conference/conference/training and meeting rooms, in schools, fitness studios or training facilities. Our Smart Widgets create the interface for this. You can use them to display the data measured by the air-Q air measurement device on your website, on info screens in your rooms or during a PowerPoint presentation.
In order to display the widgets, you only need a permanent internet connection and you have to include the HTML code in advance. The activation and deactivation of our Smart Widgets is very easy. Because they can be easily integrated by a ready HTML snippet and then update themselves automatically every 2 minutes. No matter on which device you want to display the responsive widgets, they always adapt to the screen size and are therefore always displayed optimally. This way, you can display the measurement data on small screens such as a smartphone as well as on a large screen.
In our guide you will find:
1. Create & play out air-Q Smart Widgets: How it works
Step 1: Set measured value
Step 2: Map live data or static value
Step 3: Select display type
4.1 Smart Widget Type Index
4.2 Smart Widget Type Numeric
4.3 Smart Widget Type Chart
5. integration of smart widgets into a powerpoint presentation
6. explanation video step by step guide
1. Create & play out air-Q Smart Widgets: How it works
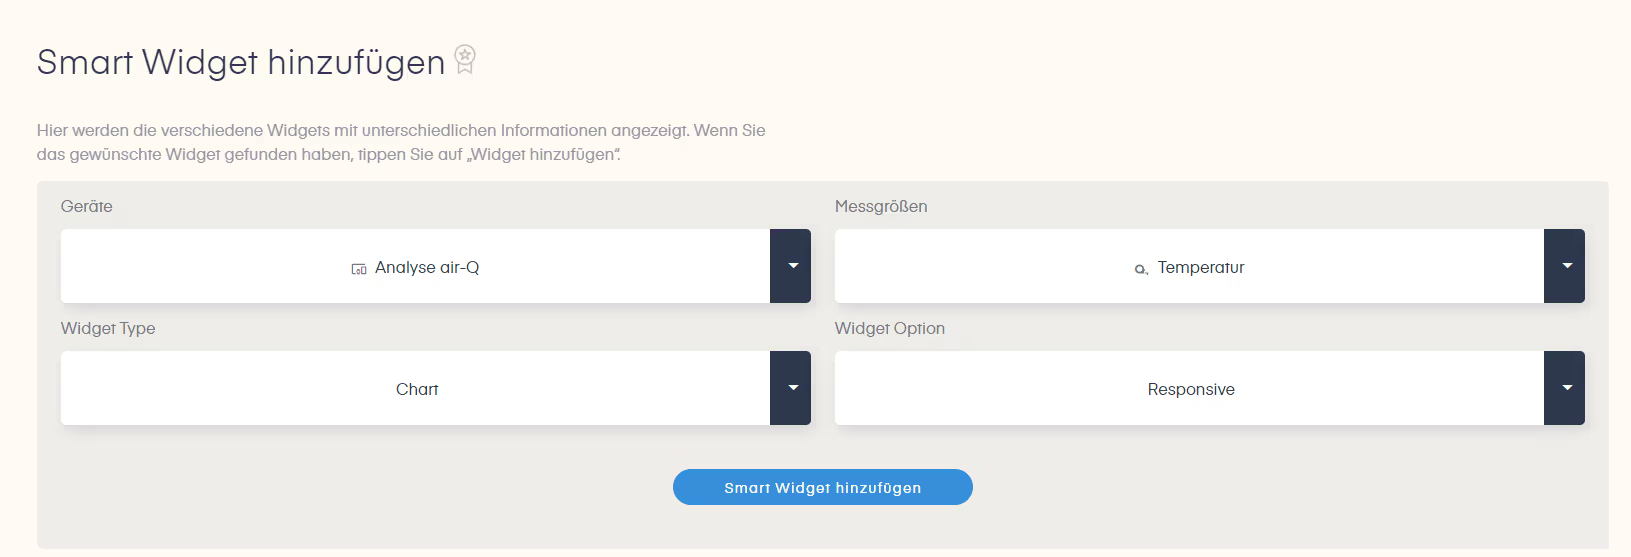
This is what the home screen for customizing your smart widgets looks like. Here you have several choices via drop-down setting:
- You select the desired air-Q device.
- You determine the desired measured value to be presented from all measured values.
- You store the display type of the measured value: as a chart, index or a numerical display. (The individual types are described in detail below.
- You define whether a live value or a static value is to be displayed.
Step 1: Set measured value
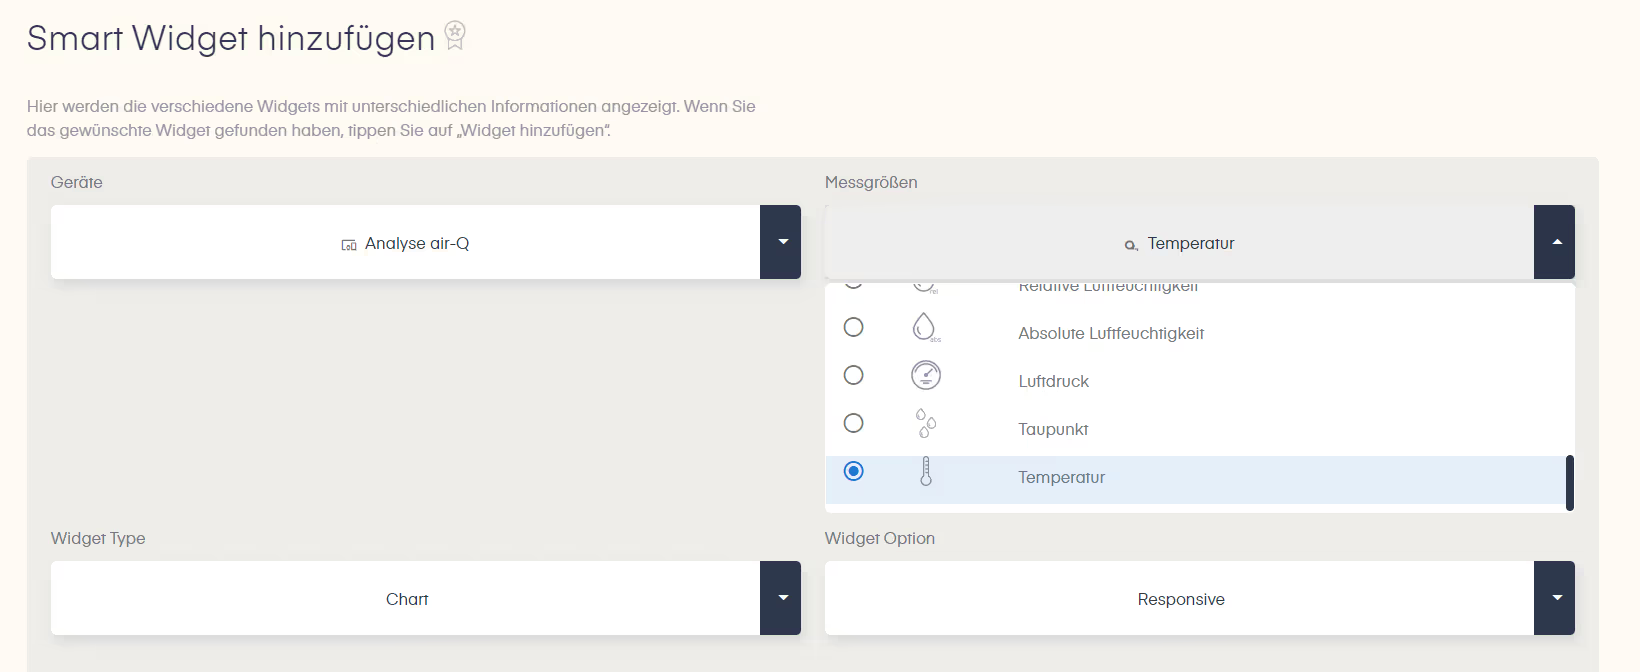
To select your desired measured value, click on the arrow under "Measured values". A drop-down opens in which all measured values are listed. Select your desired measured value by tapping/clicking. In our example, the measured value "Temperature" is set. The activated settings are each marked as a line with a blue background.
Step 2: Map live data or static value
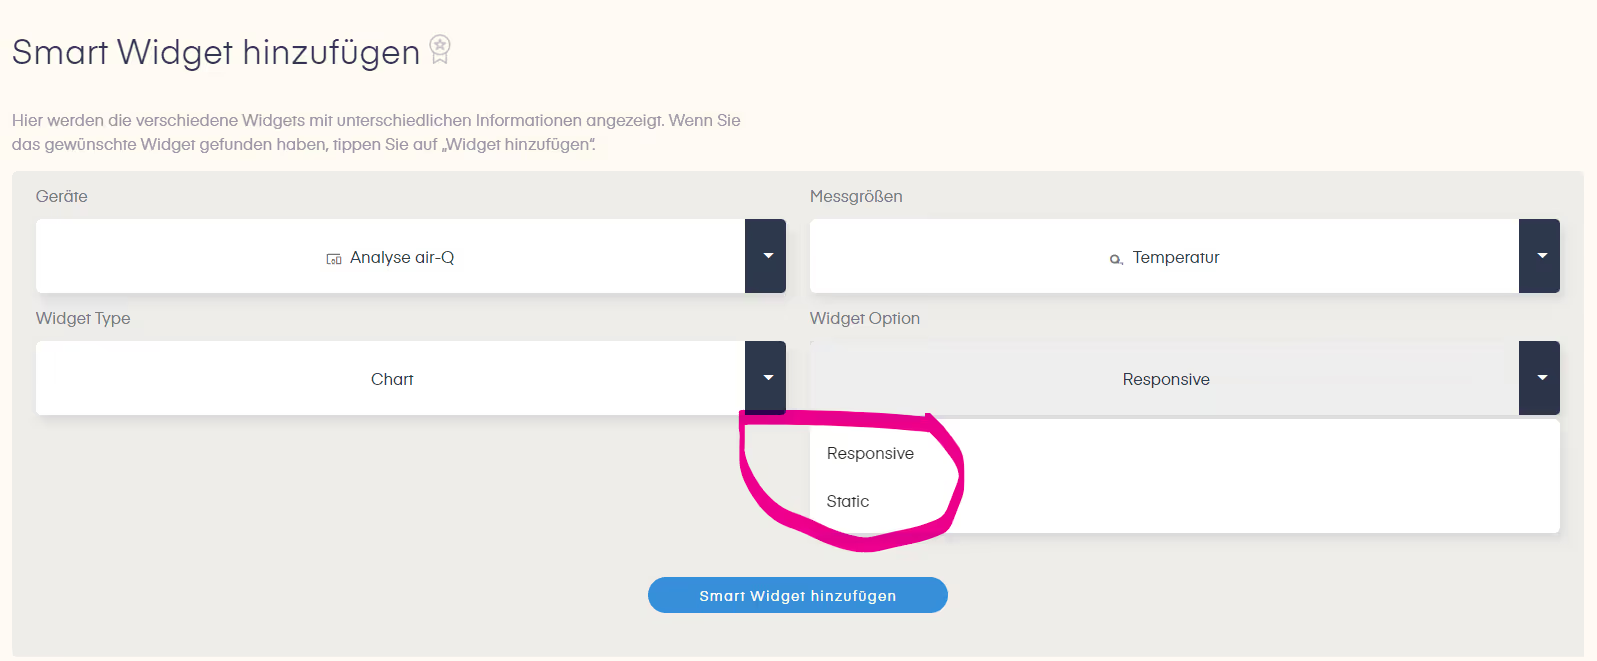
Then define under "Widget Option" via drop-down whether you want to display a responsive or static value. By tapping/clicking on "Responsive", updating values, i.e. live data, are displayed. By tapping/clicking on "Static" you can display a static snapshot.
Step 3: Select display type
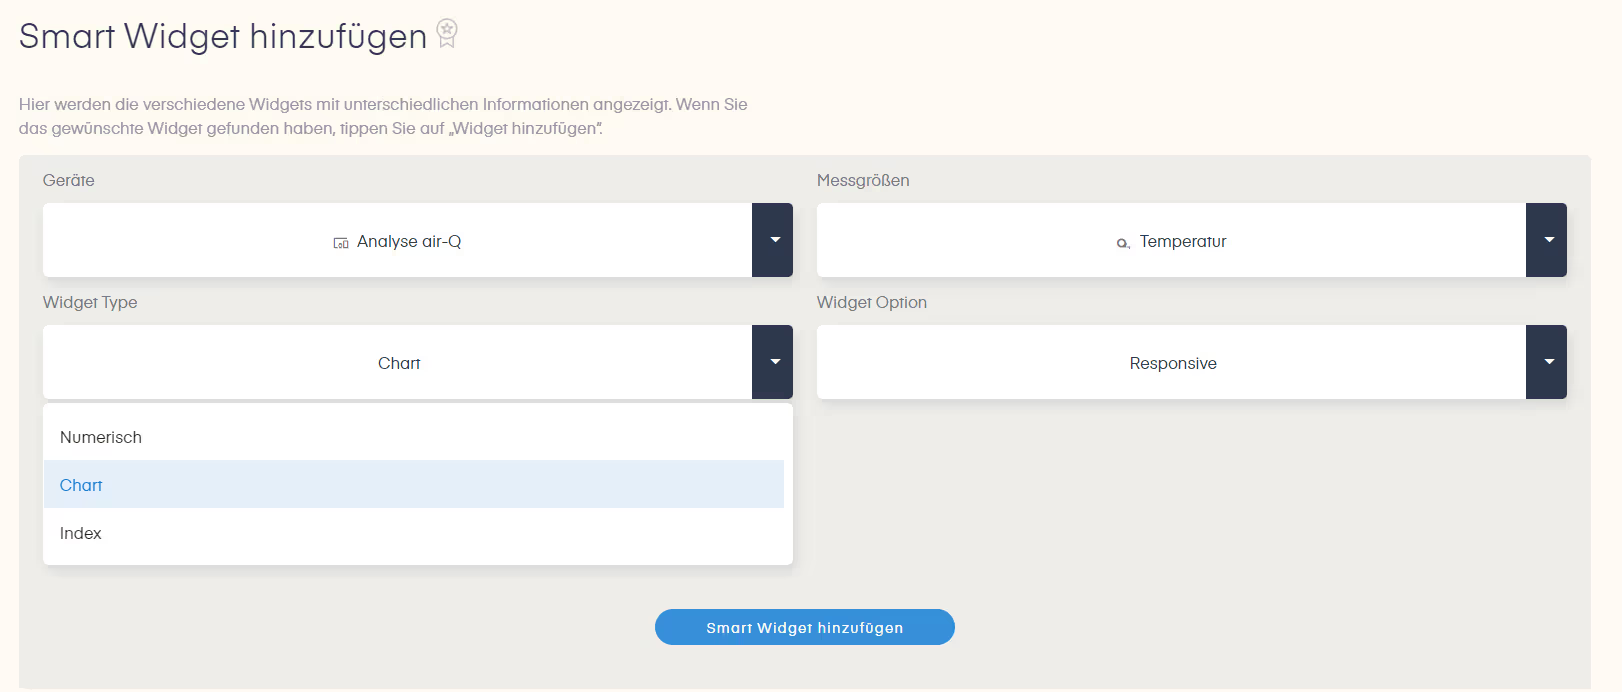
Finally, under "Widget Type", you select the format in which your measured values are to be displayed by the Smart Widgets. So you define the look: "Numeric", "Chart" or "Index". To do this, also tap/click on the arrow, open the drop-down and select your desired display type. If your setting is complete, save it by tapping/clicking the "Add Smart Widget" button.

When the widget is created, you will see a corresponding message text. The process may take a few minutes. If the widget is activated, it will be displayed in the preview below the settings.
4.1 Smart Widget Type Index
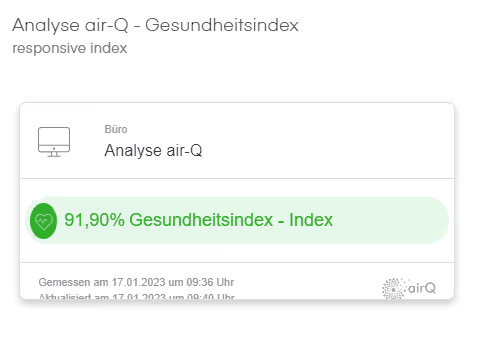
Similar to a barometer, the index shows you the selected measured value and indicates the percentage quality of the index. You can select the following indexes:
- Health Index
- Performance Index
- Virus-free index
Depending on the selected index, you will learn how good or bad the air quality is in the room and get conclusions about the impact on your health as well as performance and the risk of infection.
Tip: You can read how our virus-free index works in our blog post.
4.2 Smart Widget Type Numeric
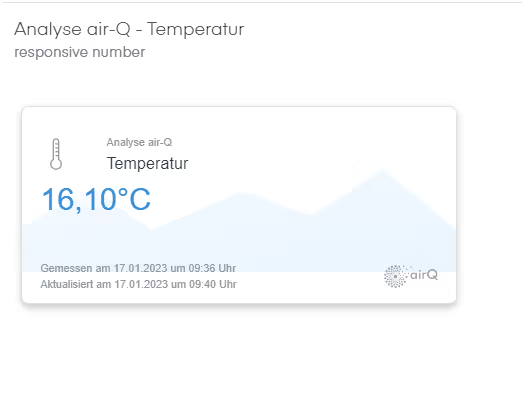
Use the "Numeric" widget type to display the concentration of the measured value as a number.
4.3 Smart Widget Type Chart
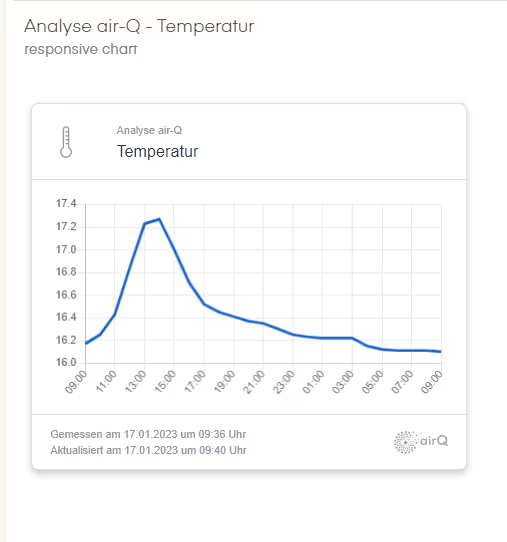
To show the measured value in its development (24h), select the "Chart" widget type. Using a chart, you can display the concentration over time in a coordinate system.
Note: Creating charts sometimes takes a little longer. You can refresh the page in between if the widget is not ready after a few minutes. Usually it is activated then.
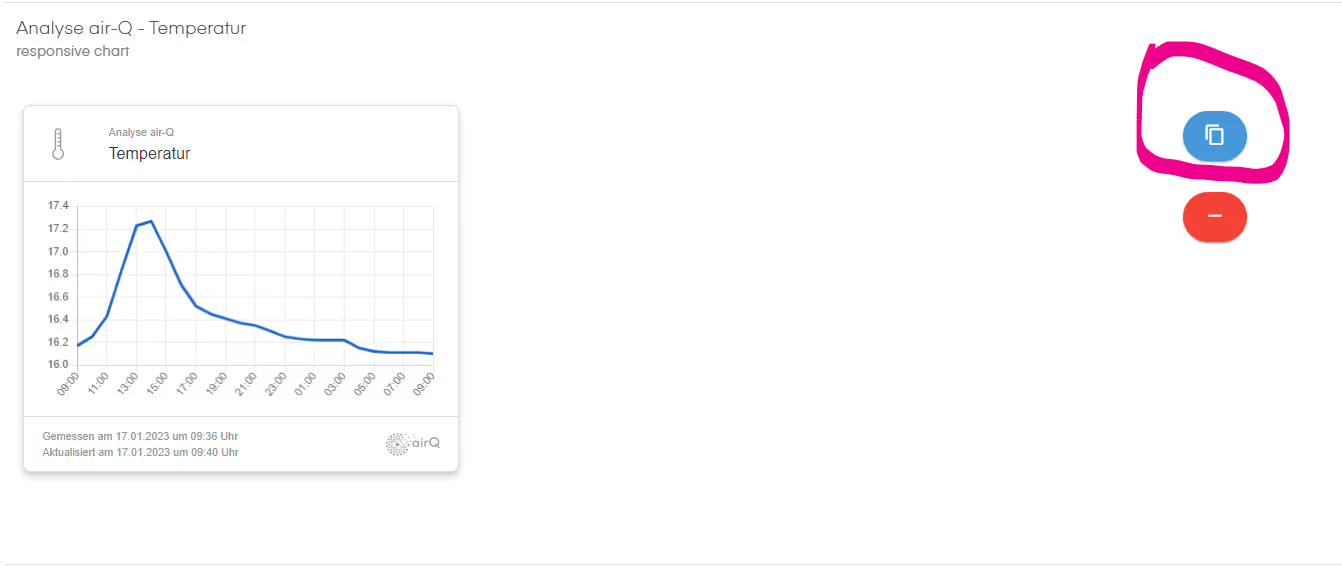
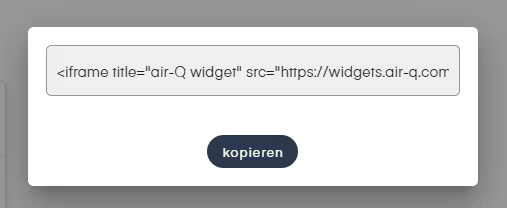
Using the duplicated page button, top right, you can copy the code snippet. To embed the widget on a website in the backend, you need to copy the entire code. To do this, tap/click the "copy" button.
5. Integrate air-Q Smart Widgets into a PowerPoint presentation.
For the integration of the Smart Widgets you need the Web Viewer Plugin from Microsoft. If you have installed Web Viewer, you can select the drop-down "My Add-Ins" under "Insert" when creating your presentation in PowerPoint and store the "Web Viewer" here.
Then create one or more widgets in the air-Q Cloud or under My air-Q. Then paste the URL of your air-Q Smart Widget into your Webviewer add-in by entering the URL in the field. The deposited widgets can now be edited and moved around like an image, so you can style your page just the way you want.
How to integrate the widget into a PowerPoint presentation, we have also summarized in an extra tutorial. You can download this as a PDF.
6. our video tutorial
With our widgets you offer your customers informative entertainment. In addition to the entertainment value, you emphasize your claim to health and a quality indoor air. This ensures trust among your customers, employees and co.
Contributed image: air-Q/canva.com


