The Smart Hub — the air-Q smartphone app
The air-Q app for Android and iOS serves as the hub for air-Q and your personal air quality analysis. In the app, you have access to a dashboard, the air-Q air quality indices for health, performance, mold, and viral load, as well as all sensors, measured values, and graphs. This makes it easy to keep track of your air quality.
Access sensor readings from anywhere and analyze air quality data
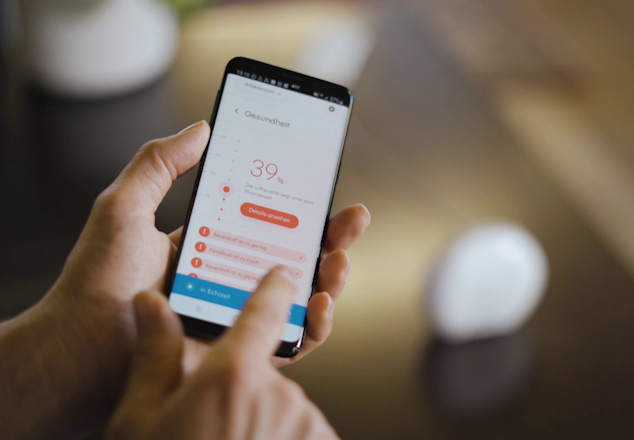
You can view and access all the data using the air-Q app for iOS and Android. The mobile app’s setup wizard connects the air-Q to your home network via Wi-Fi. Creating an online account is not required, but it provides additional features, such as the health advisor with recommendations for improving air quality if a problem is detected, or the ability to use the air-Q app while on the go. In addition, you can then use the air-Q Web App, which offers even more options for analyzing air quality.
The air-Q app is available on the following platforms:
Find out about all the gases and particles in the air you breathe.
All your air-Q devices at a glance on the dashboard
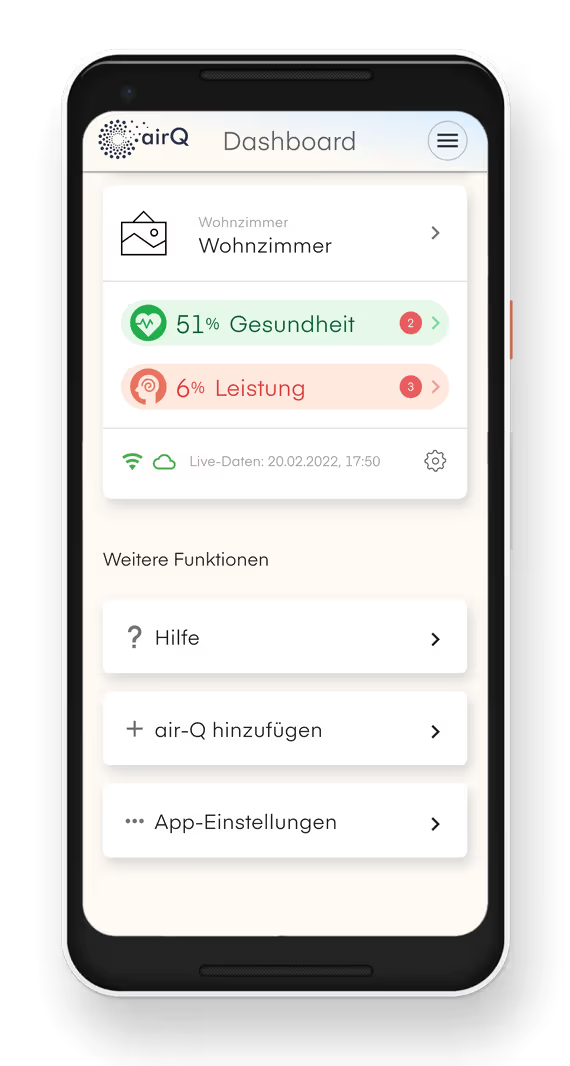
The panel clearly displays the readings from all air-Q devices. This allows you to monitor the different rooms in your home (for example, the living room or a child’s bedroom) or even outdoor locations (for example, an office) from a single control center. Here, you can immediately see if something is wrong somewhere and action needs to be taken.
The air-Q indices for health, performance, mold, and viral load
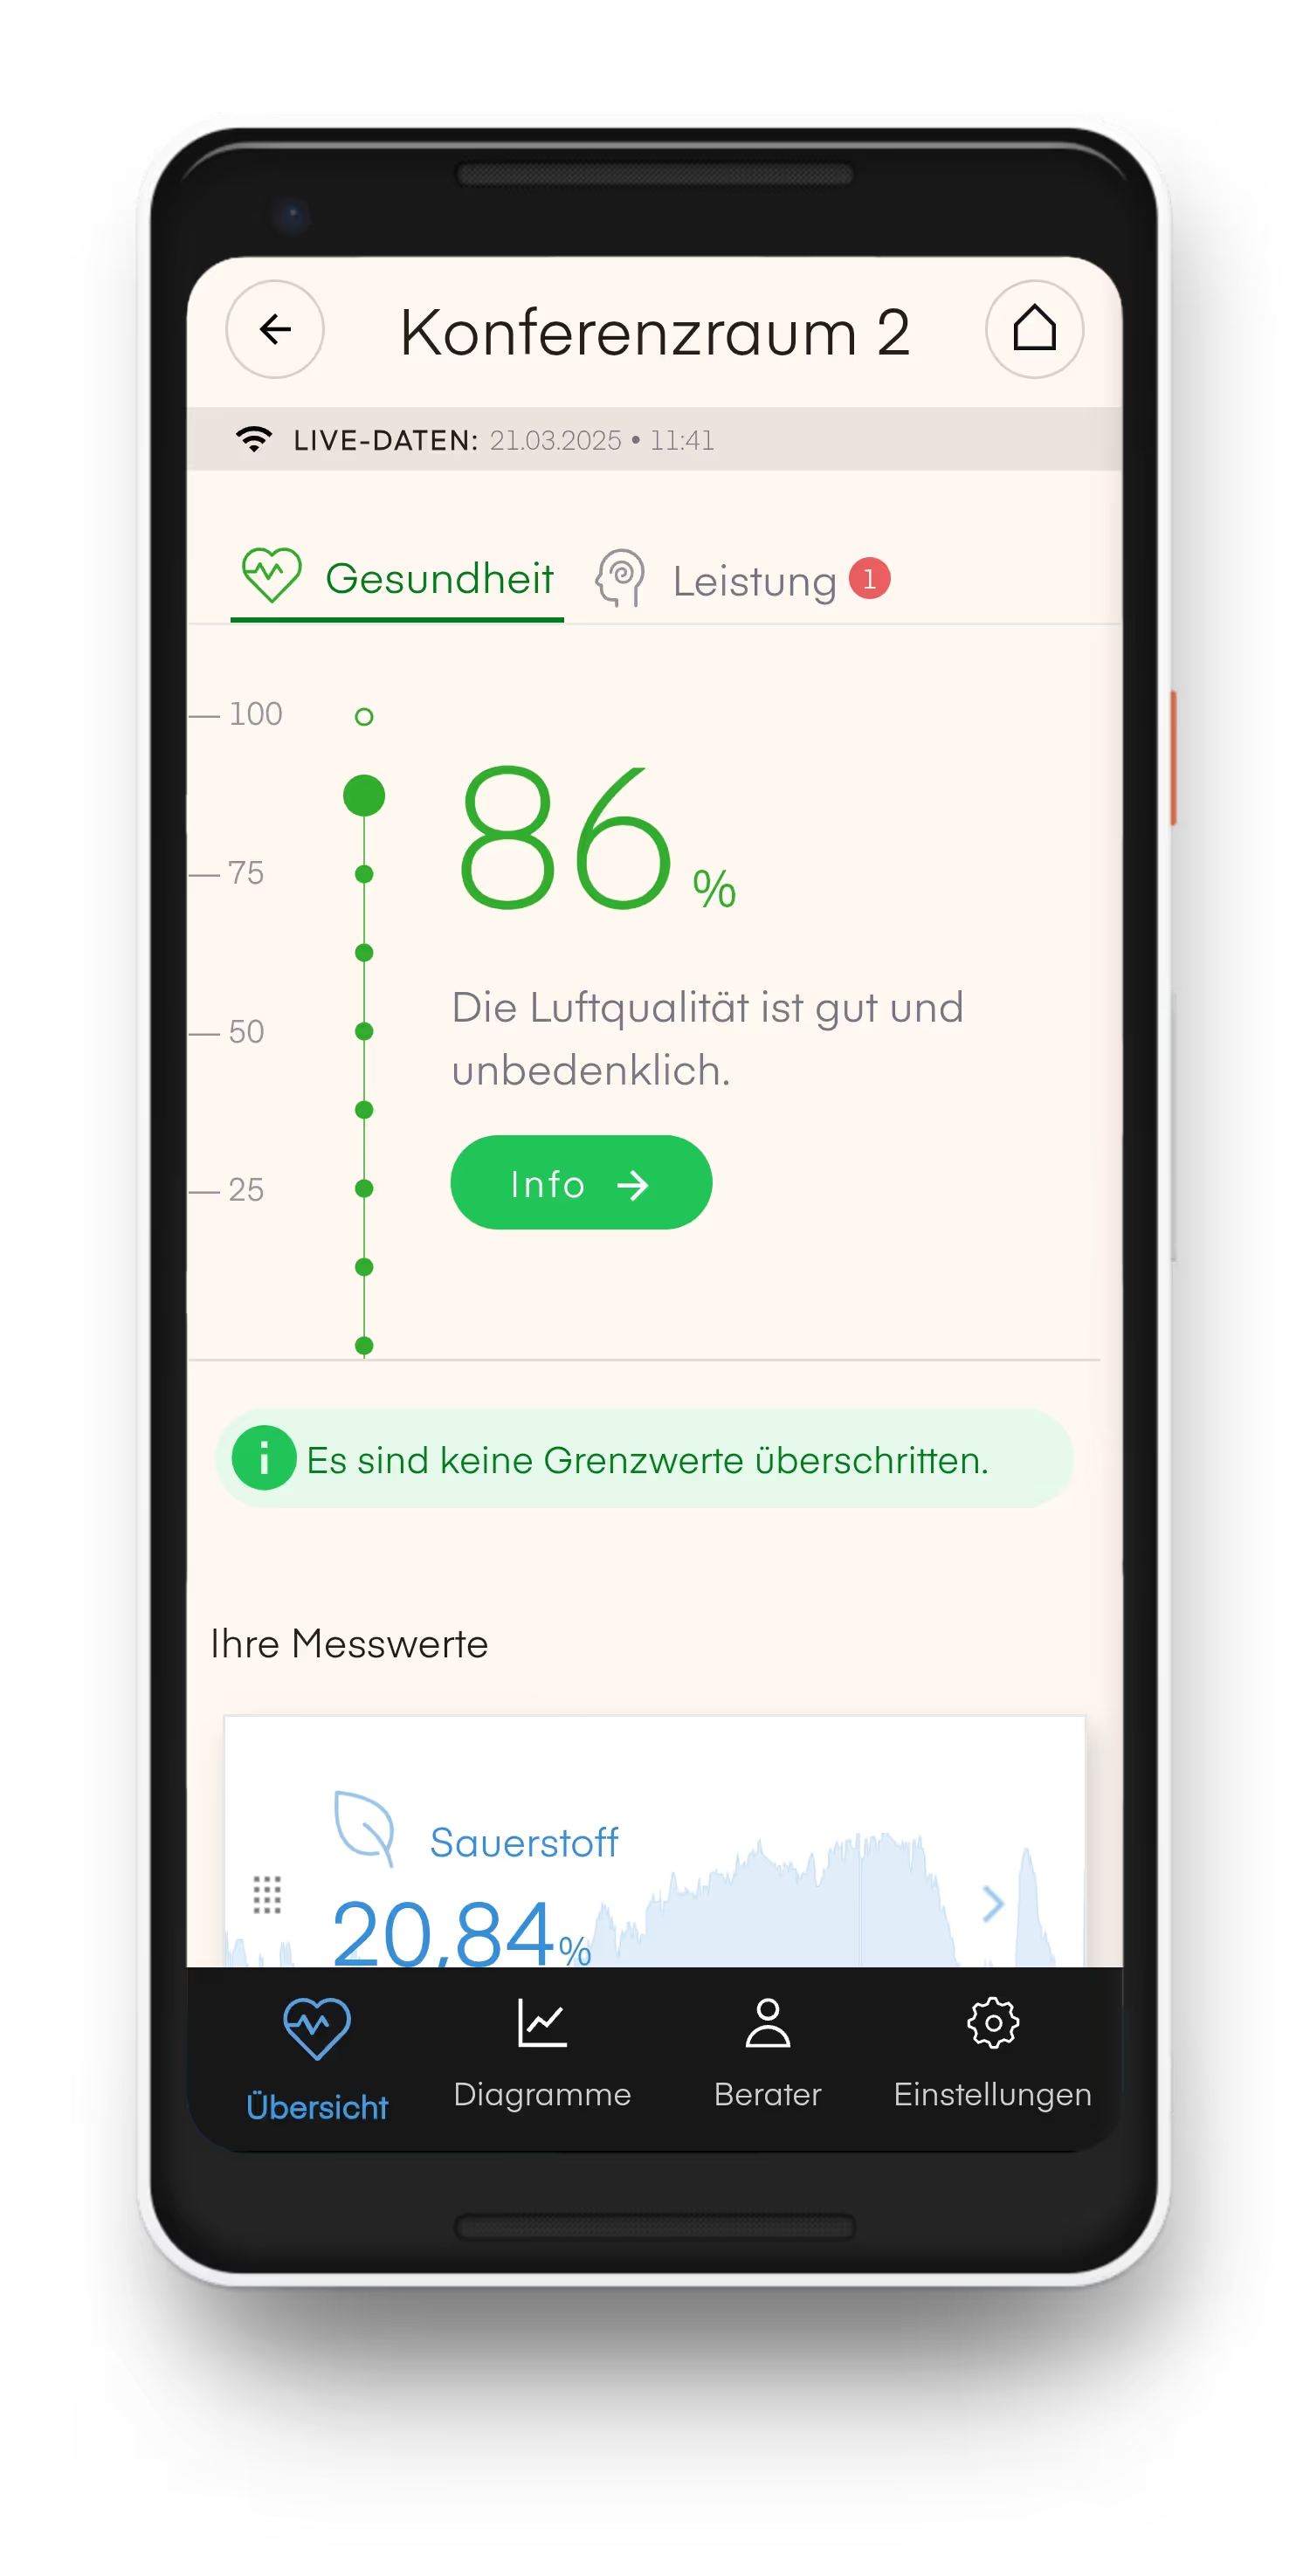
To quickly provide you with an overview of air quality, the air-Q analyzer calculates health, performance, mold-free, and virus-free indices. The air-Q air quality indices help by providing an easy-to-understand representation and interpretation of the measured values. Harmless fluctuations or non-hazardous substances are filtered out. In this way, the air-Q air quality indices help identify potential problems more quickly and also suggest possible solutions.
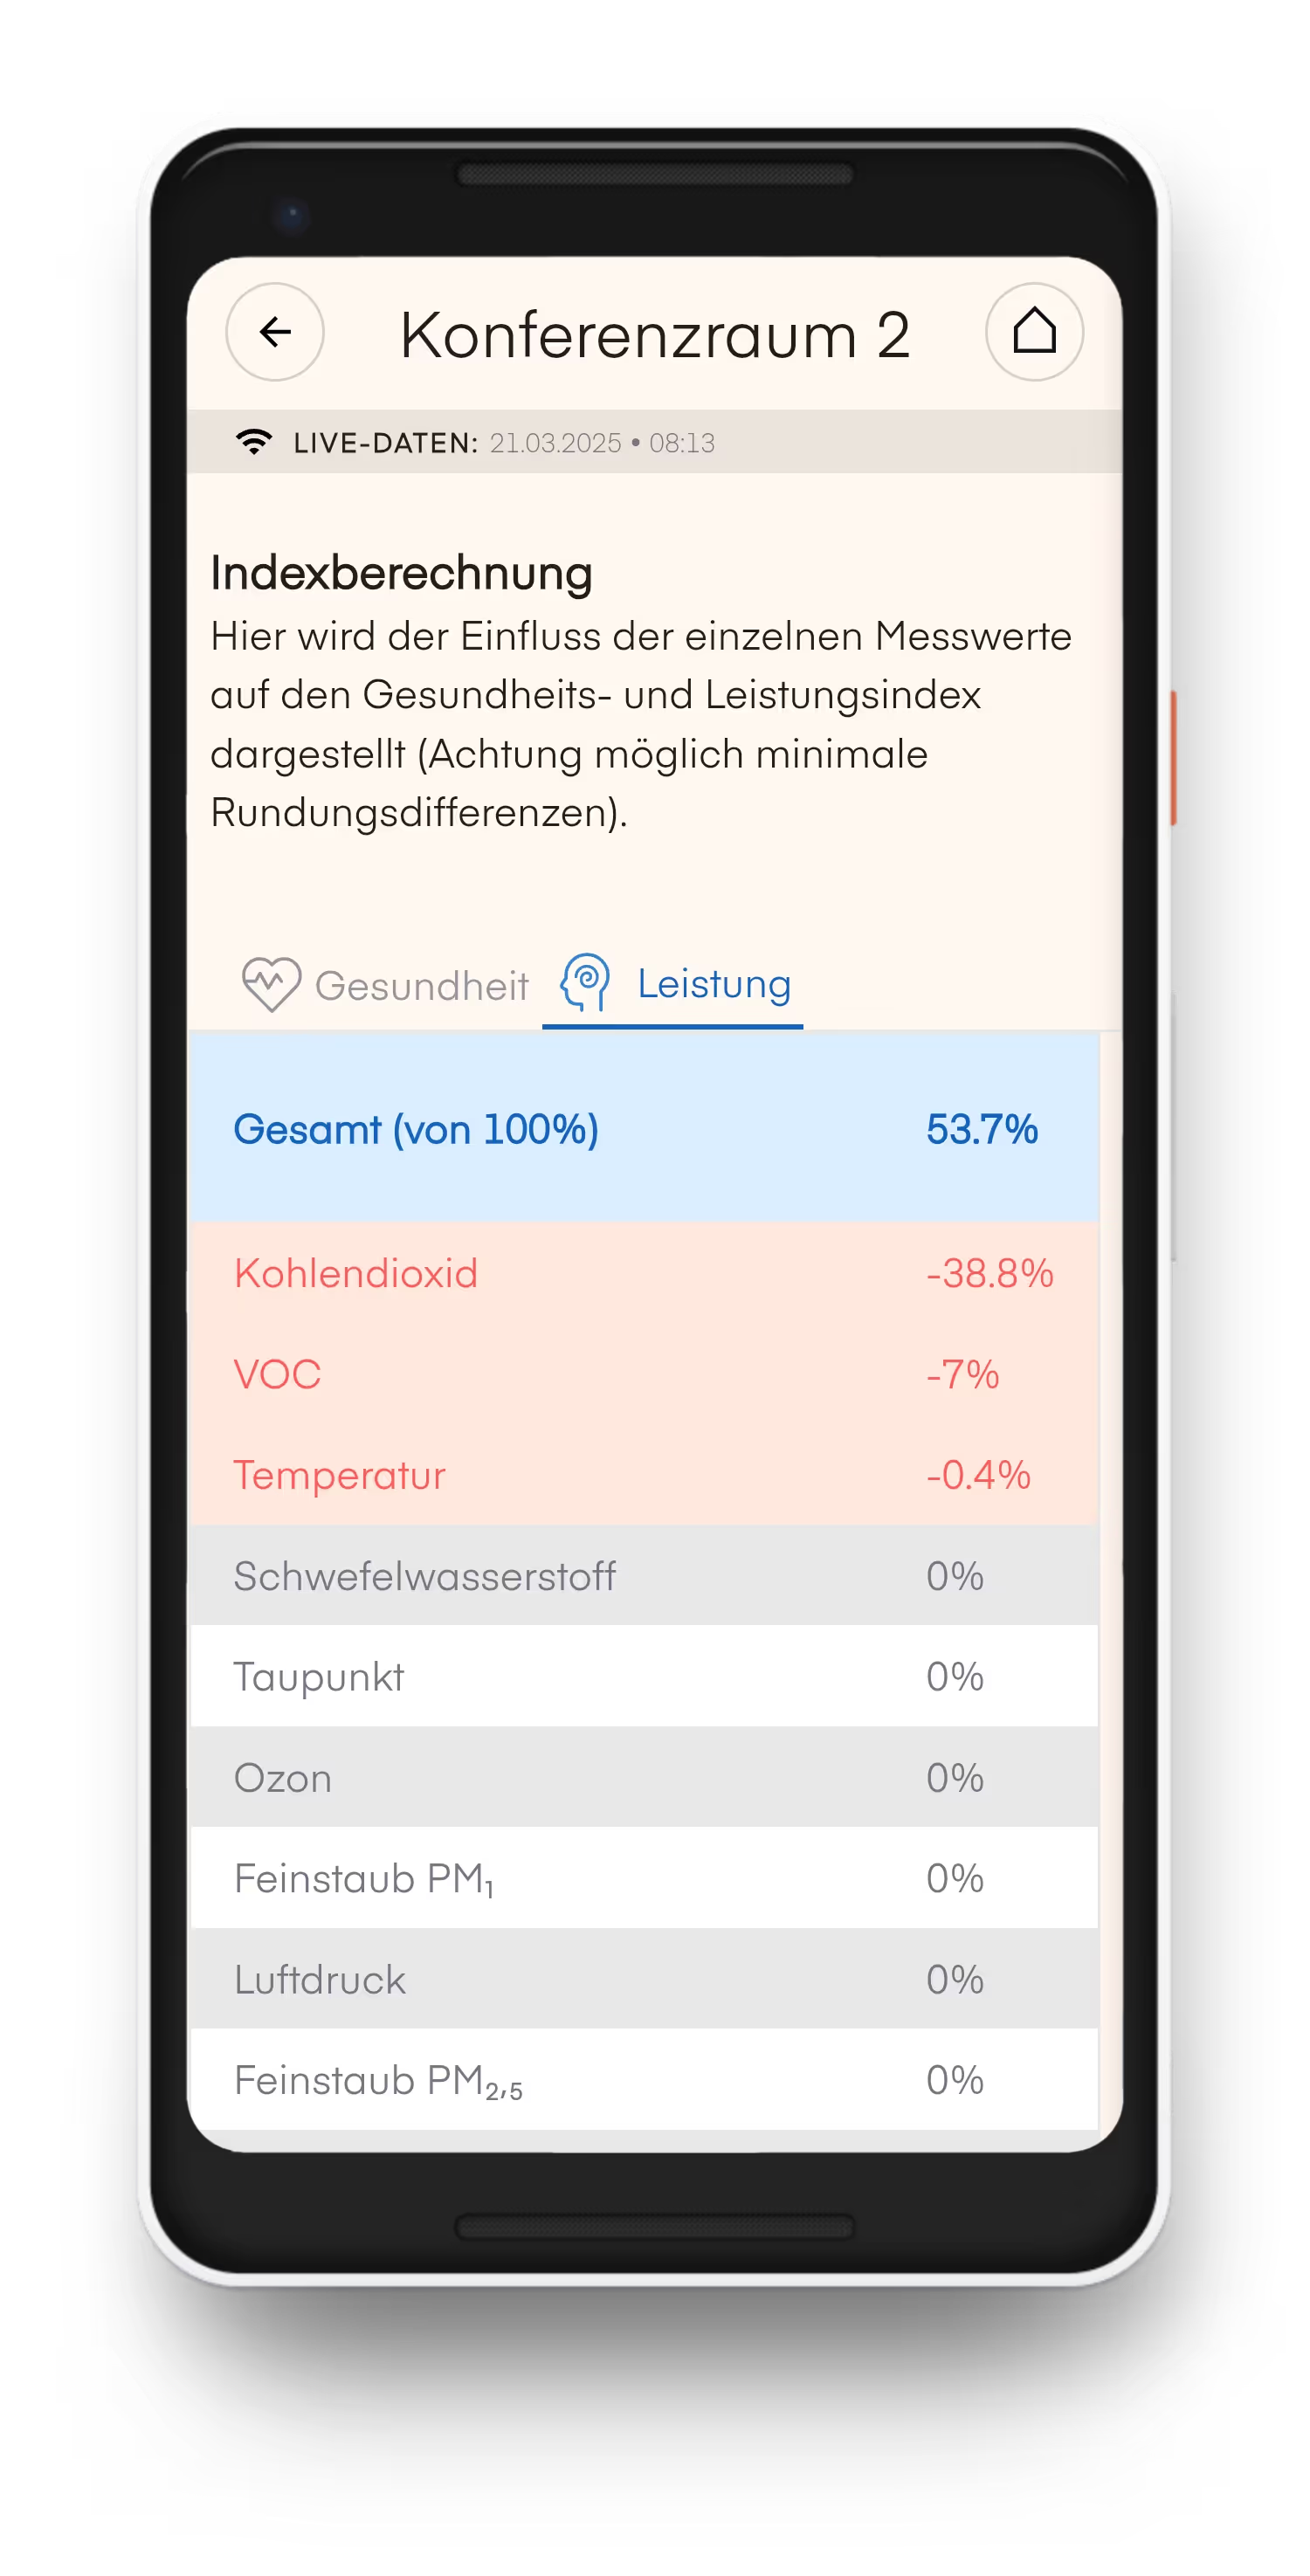
Air Quality Indices Explained
The air-Q air quality indices are based on complex algorithms. The air-Q app shows you the breakdown of the indices in real time. This allows you to see which measured values have a particularly strong influence on air quality. As a result, you can understand and influence your individual situation much more easily.
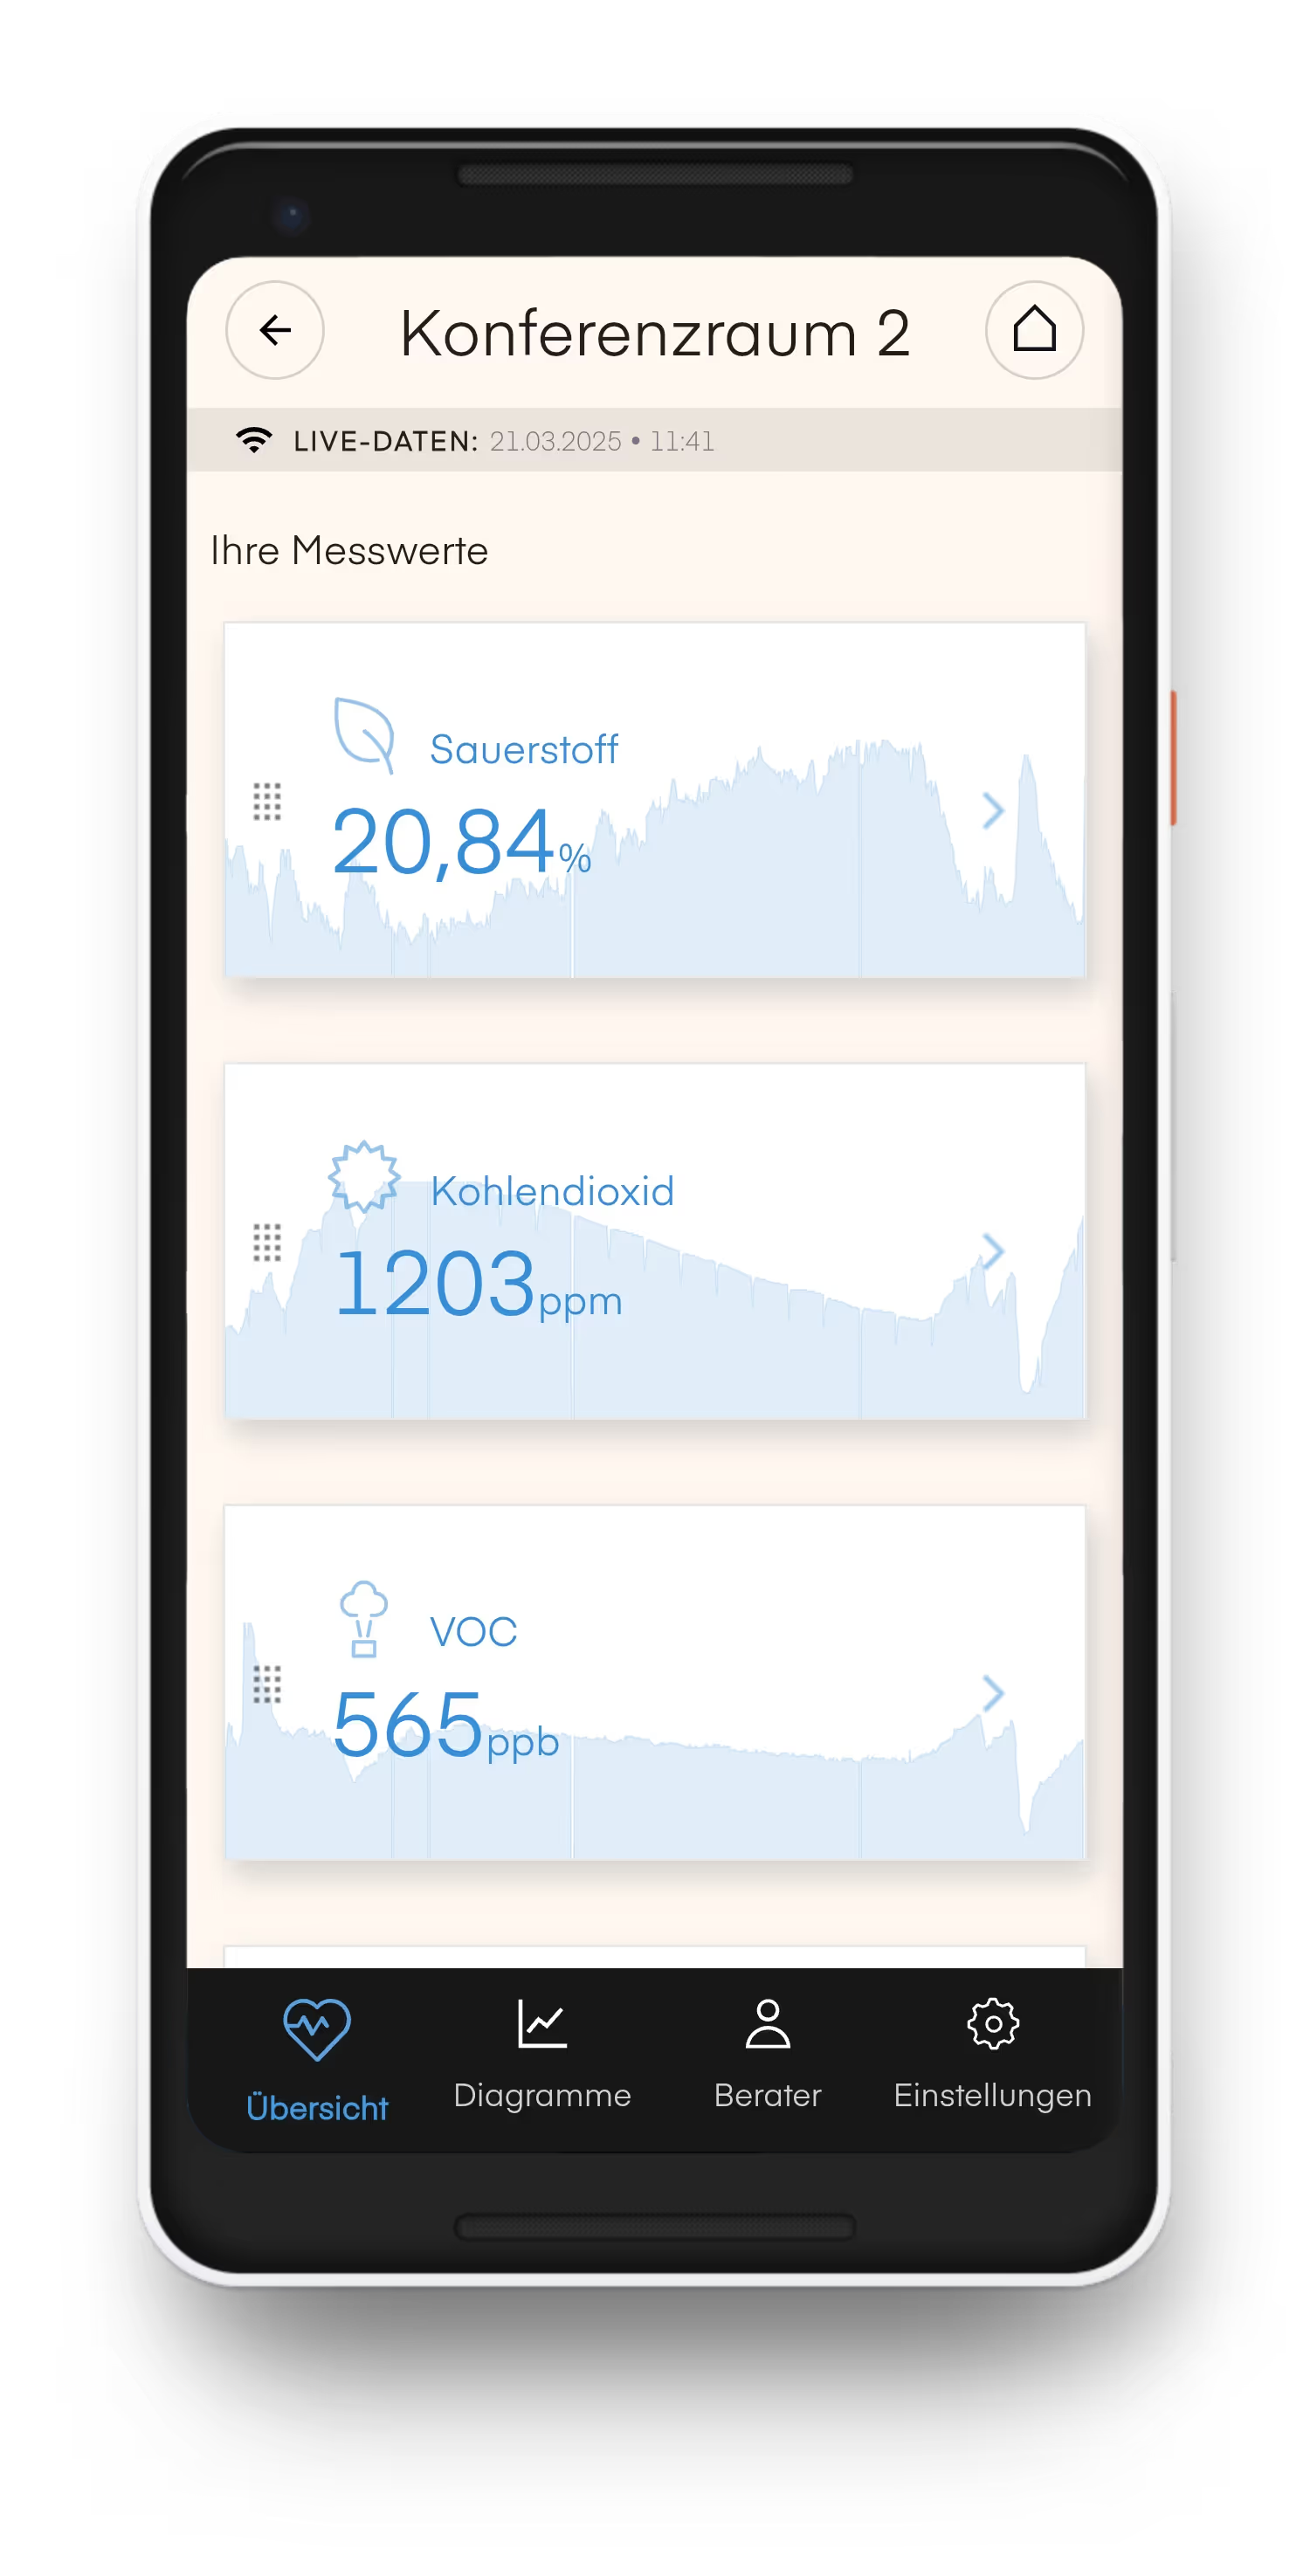
Keep all measured values in view
All measured air quality values can be viewed as a list or individually in real time. This allows you to immediately identify any notable current values and pollutants. Thanks to the brief summary of the last 24 hours for all measured values (background graph), you get a quick overview and can, if needed, drill down into individual measured values.
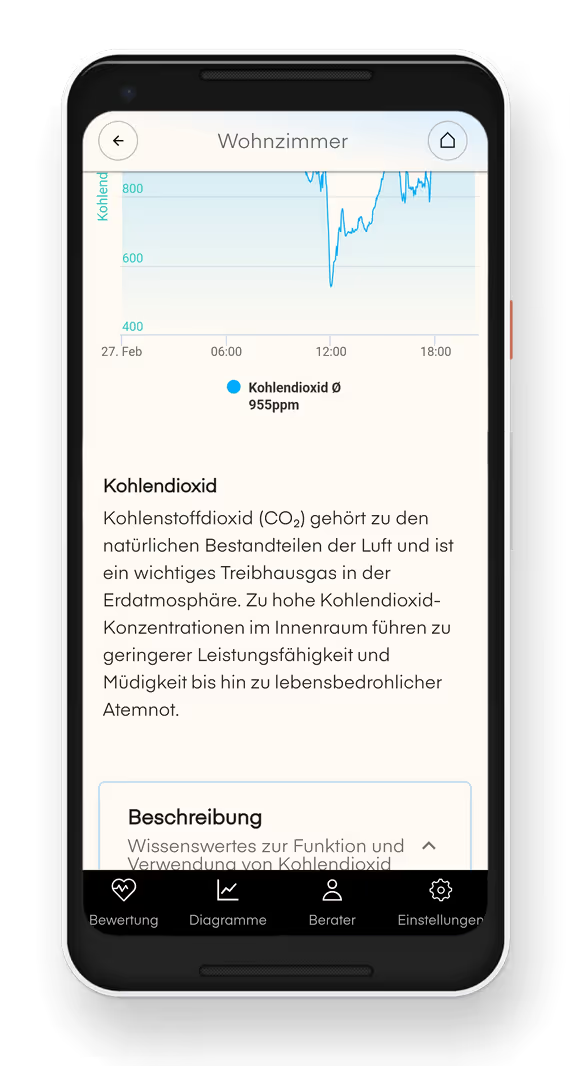
Learn more about the gases in the air you breathe
Delve deeper into the sensors, the measured parameters, and the measured values, and learn more about the air you breathe. The air-Q app provides comprehensive insight into each sensor value—from its origin and effect to how it is measured—no other product offers this much insight and transparency.
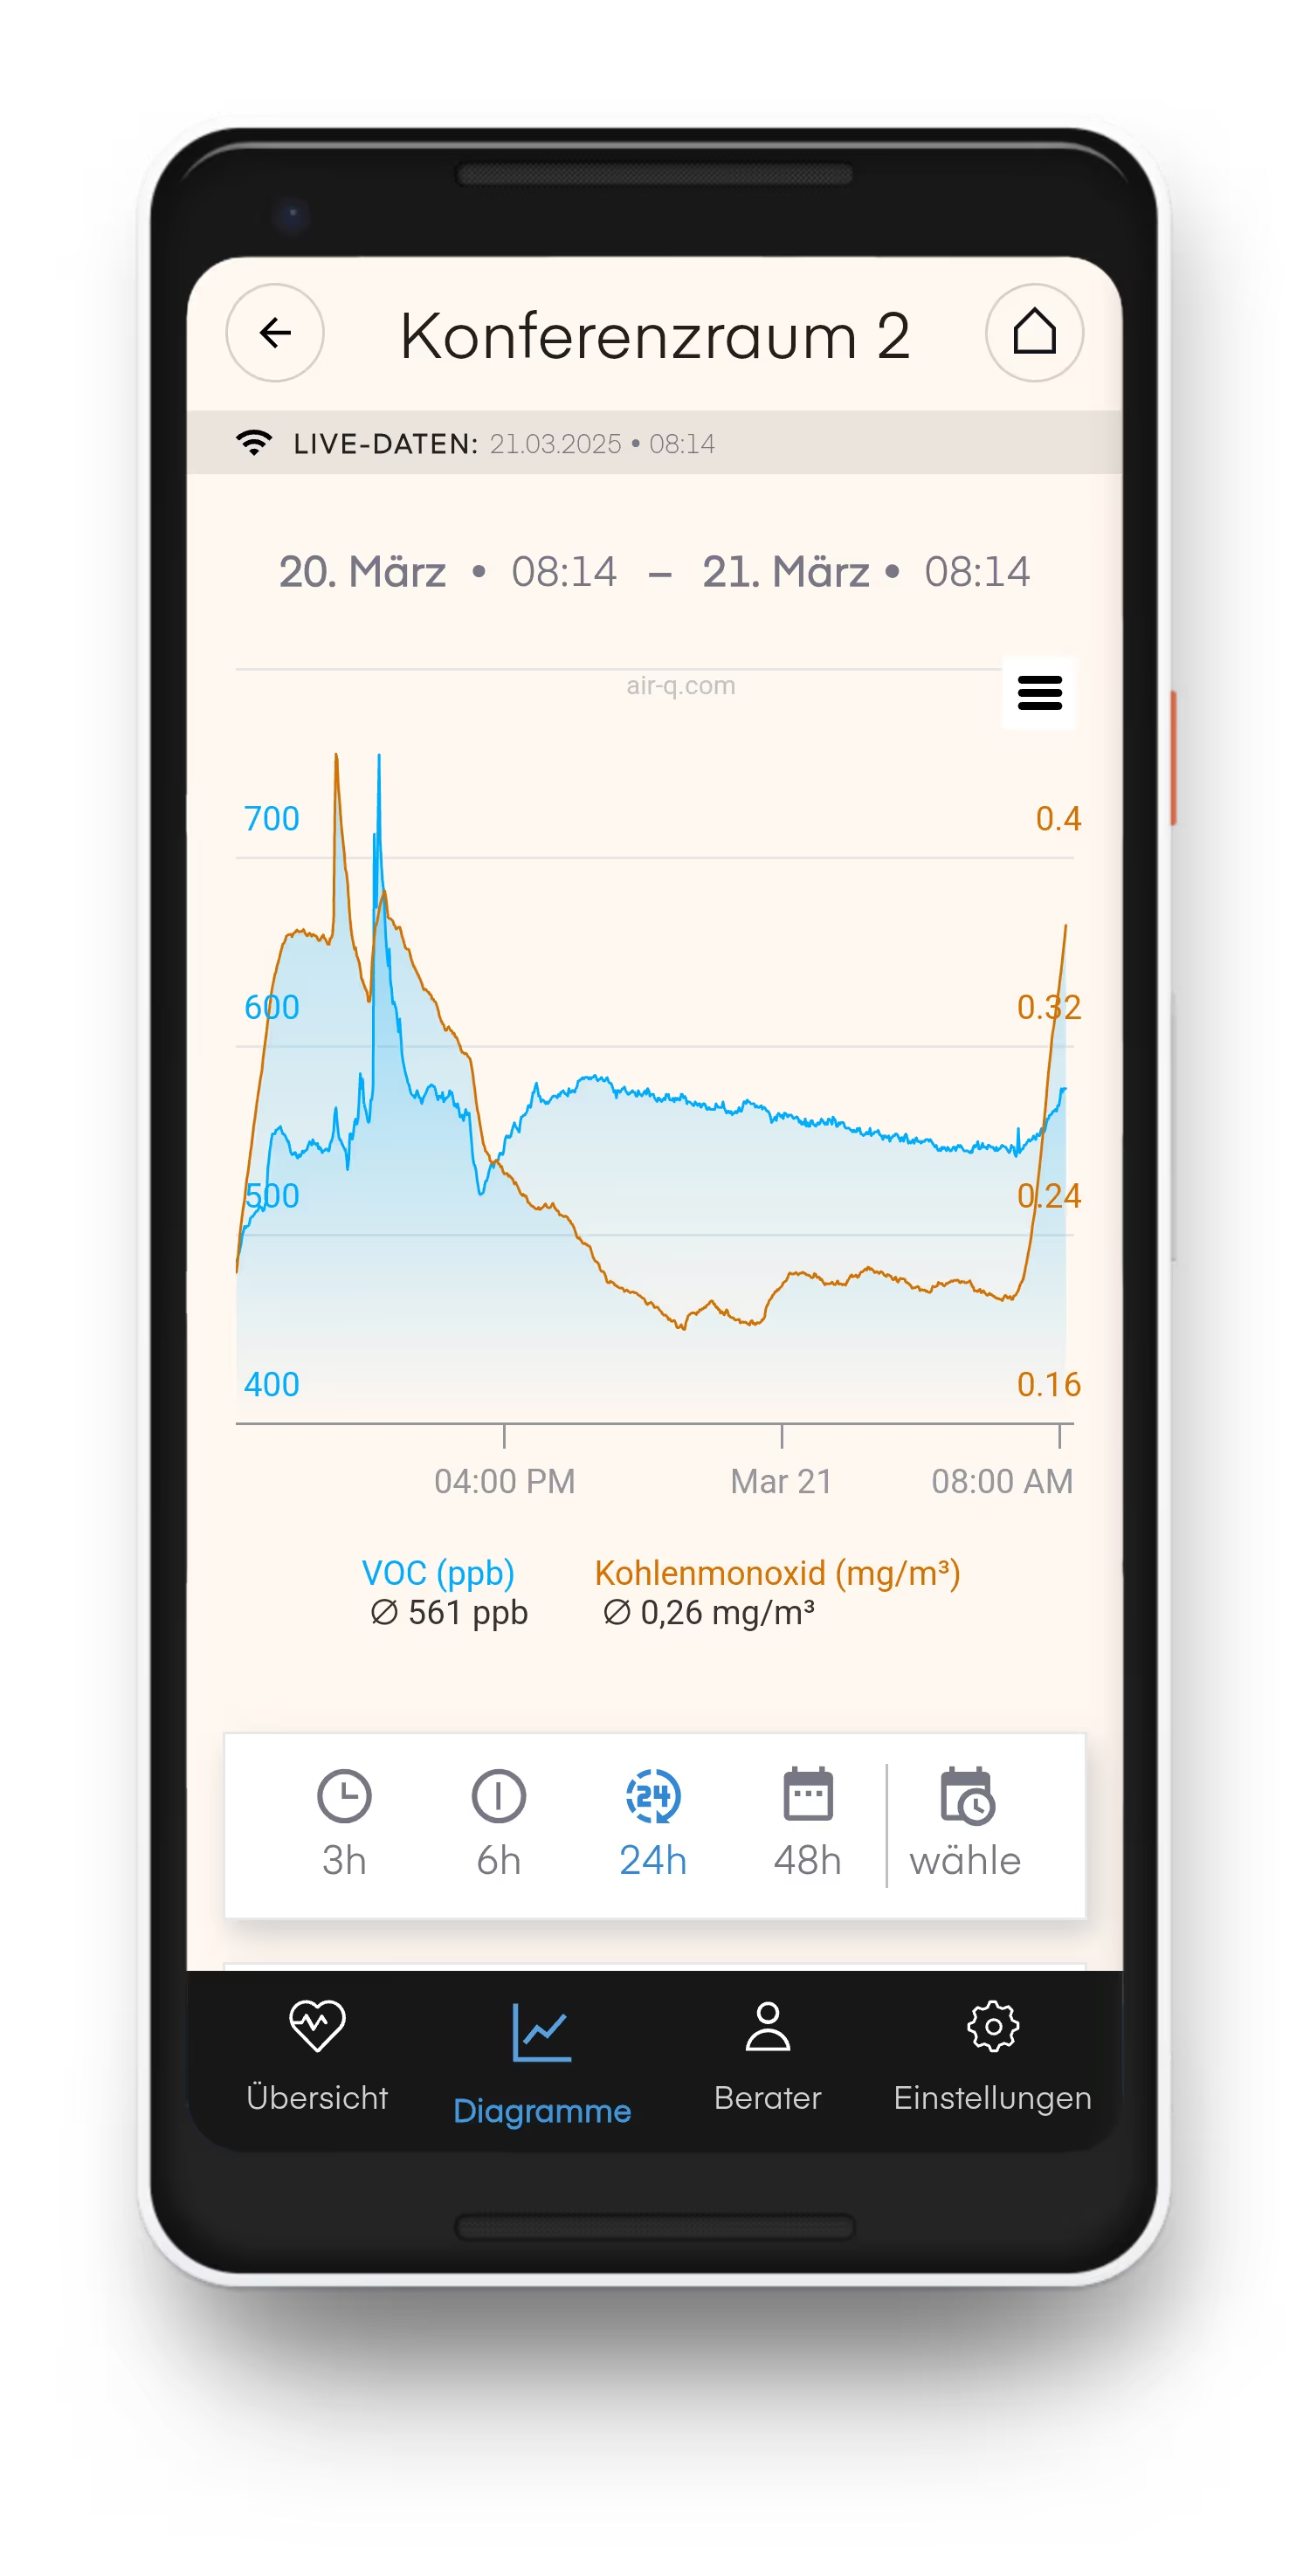
Analyze air quality data
Time series and graphs can be generated for all measured values. The time periods can be freely selected and can range, for example, from five minutes to several years. This allows you to track changes in air components and air quality over time in a completely customized way. In this way, the air-Q makes changes easily recognizable and highlights even the smallest differences. Displaying multiple measurement curves on a single graph makes it even easier to identify relationships.
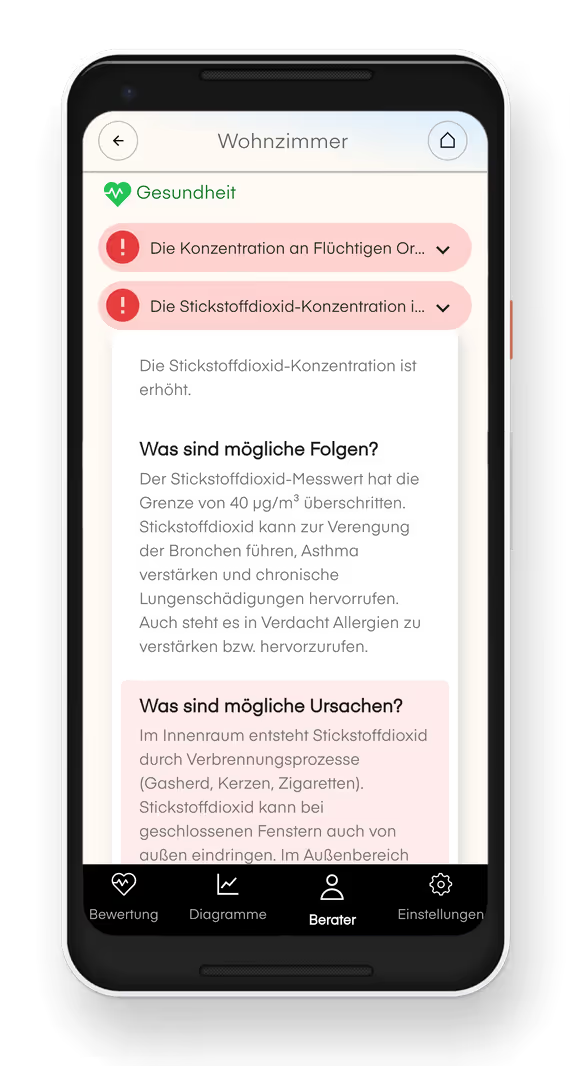
The AI Health Advisor — Identifying Causes and Taking Action
The air-Q™ health advisor uses advanced software algorithms and AI to evaluate all data on various gases, particles, and aerosols with the push of a button. The analysis includes all your current measured values and the location of the air-Q. (A free cloud account and a paid premium membership are required.)
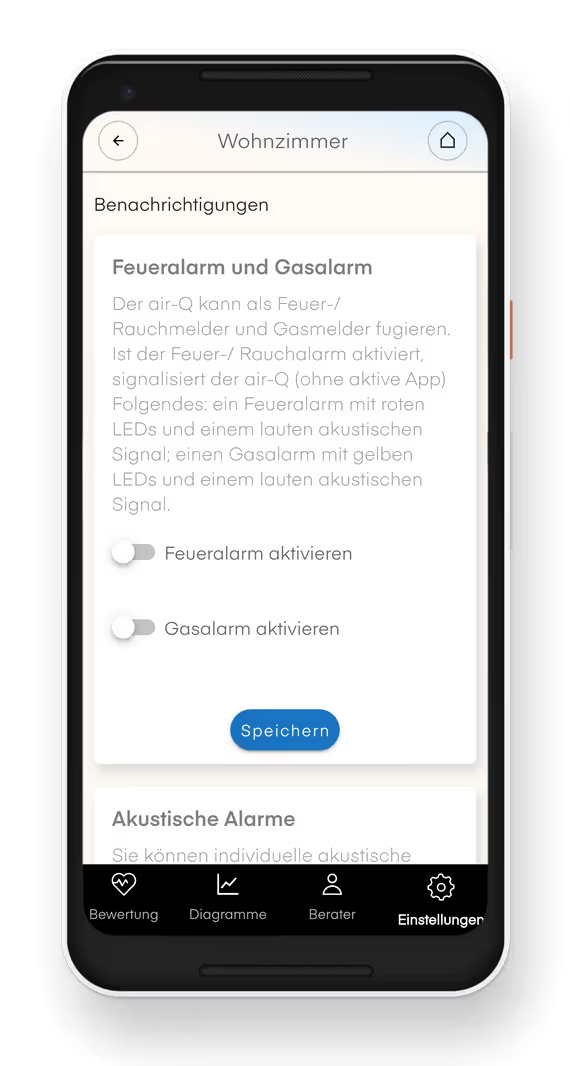
Alerts and Notifications
Customize predefined alarms, such as fire alarms, gas alarms, and thresholds for audible alerts. In addition, you can set individual limits for each measured parameter and each metric for which you want to receive a push notification or email alert.
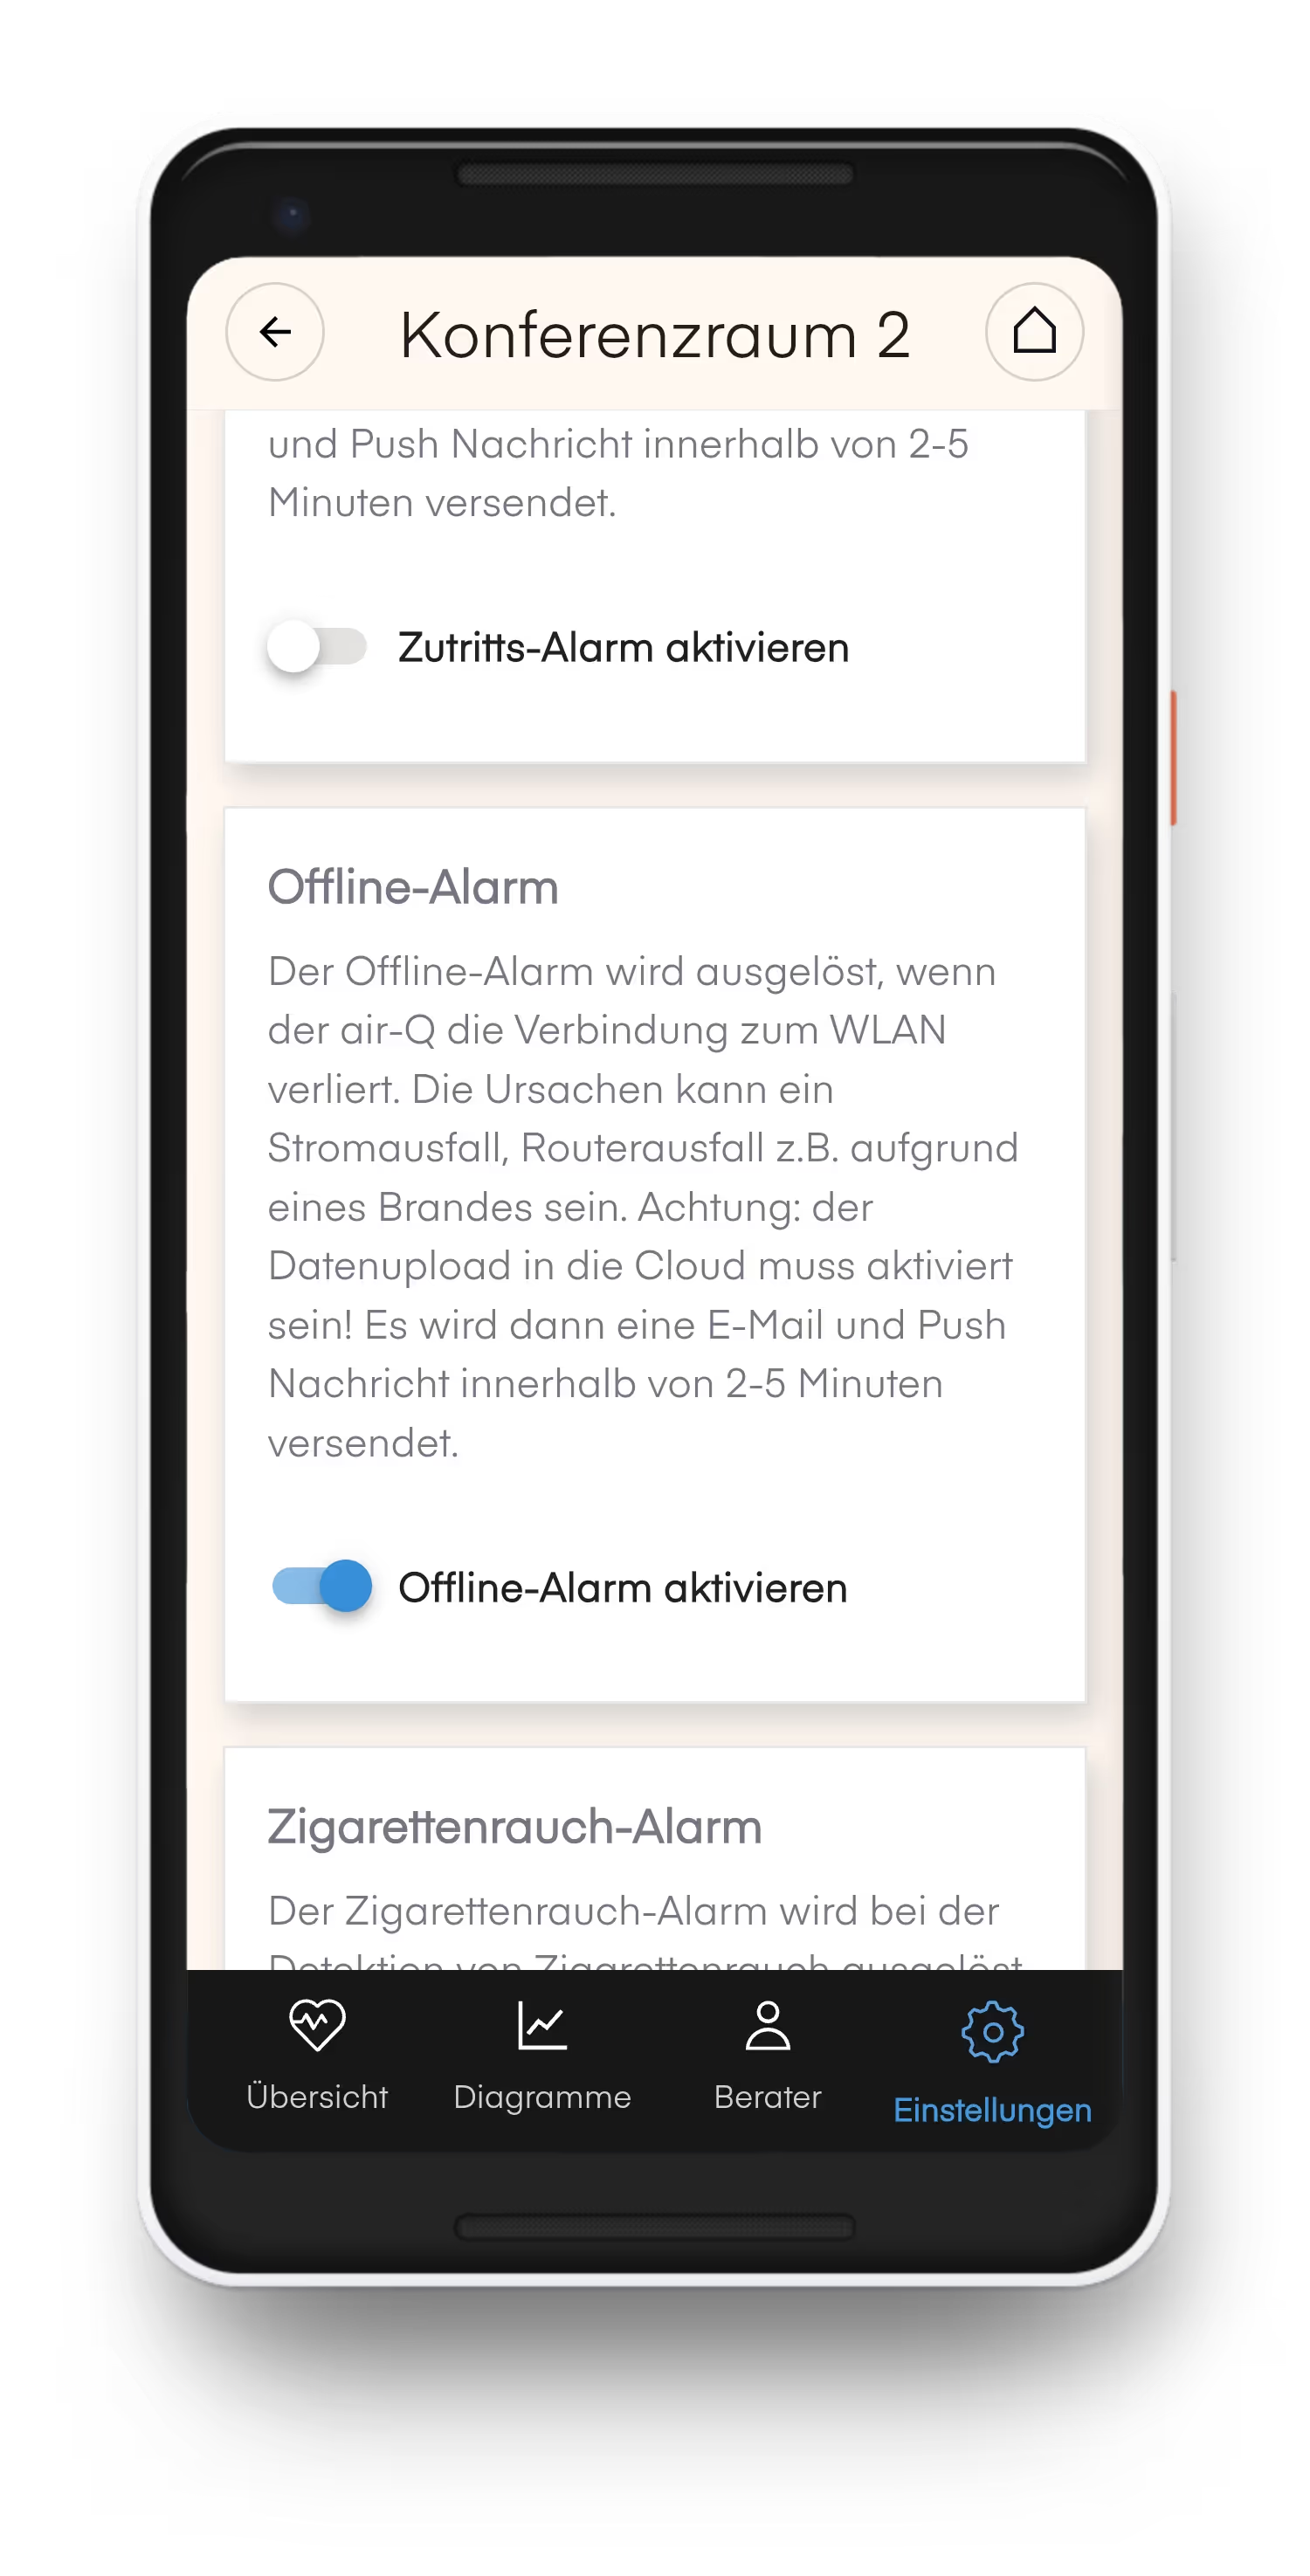
Stay informed with smart alerts
The air-Q also detects complex situations and alerts you in case of problems. Smart alarms for cigarette smoke, unauthorized access, or—for example—disconnection trigger alerts via push notifications or email. (A free cloud account is required.)
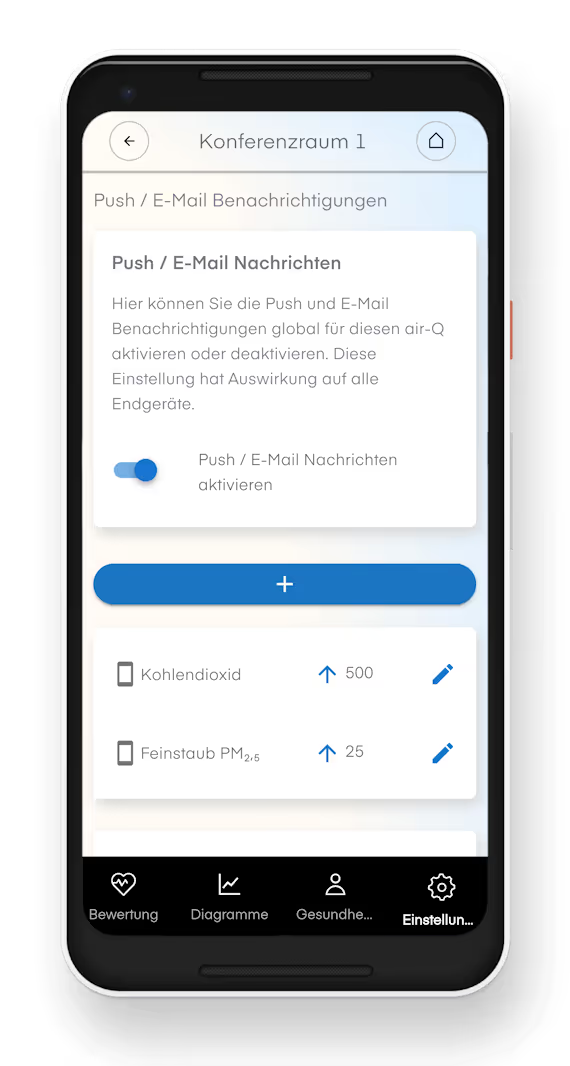
Receive information about individual thresholds
Individual thresholds for each measured parameter trigger push or email notifications when they are reached. This lets you keep an eye on your home or office and be sure that everything is “okay.” If something goes wrong, you’ll receive a message. (A free cloud account is required. A premium membership is required for a very large number of push thresholds.)
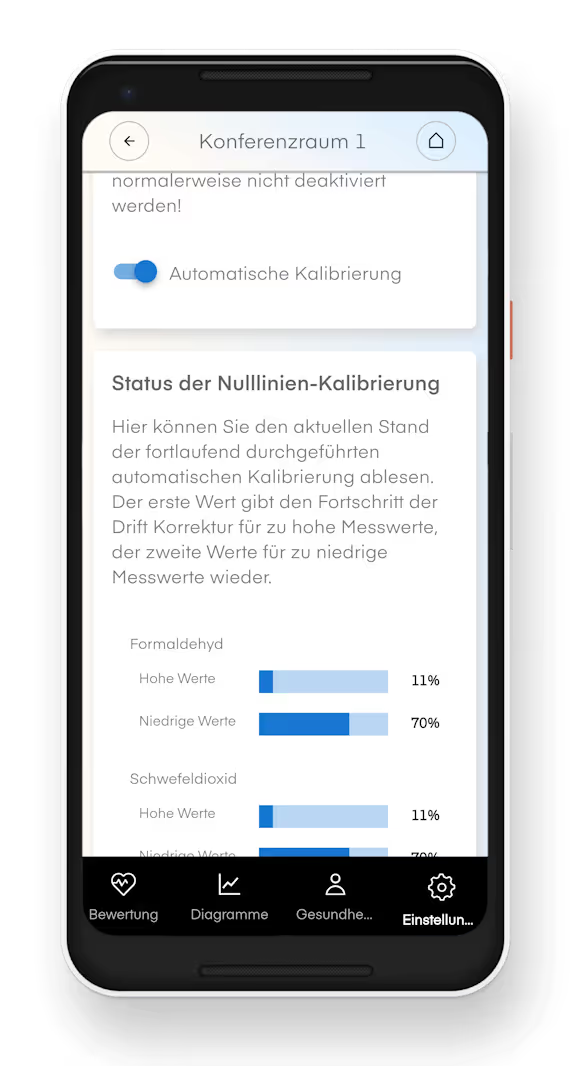
Check and adjust the calibration information
The air-Q continuously performs self-calibration: you don't need to do anything else. All calibration information and the status of the automatic calibration can be viewed in the app. Professionals can also perform a manual calibration to tailor the air-Q to their needs.
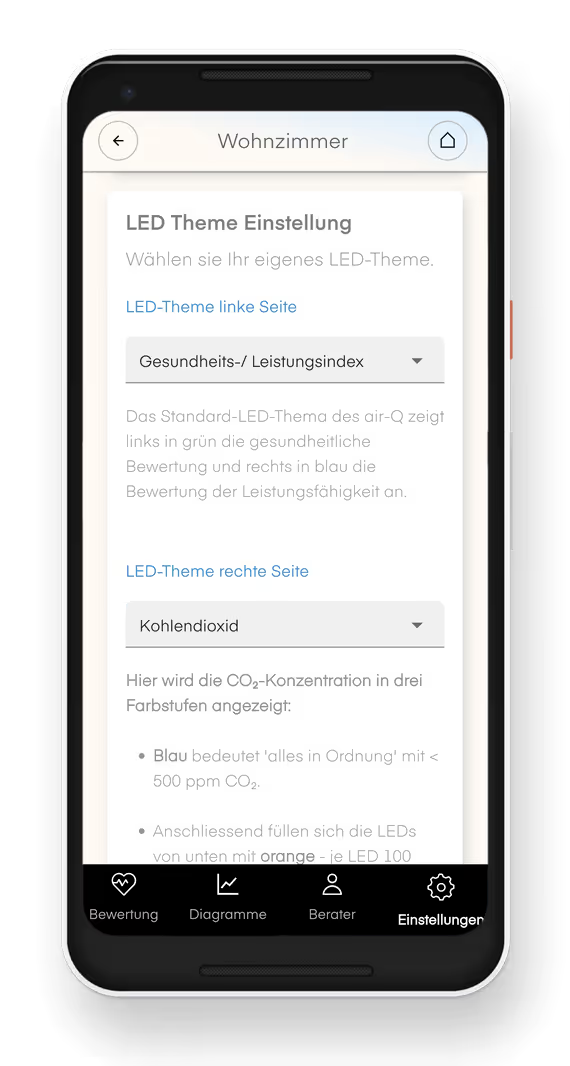
Unlimited configuration options
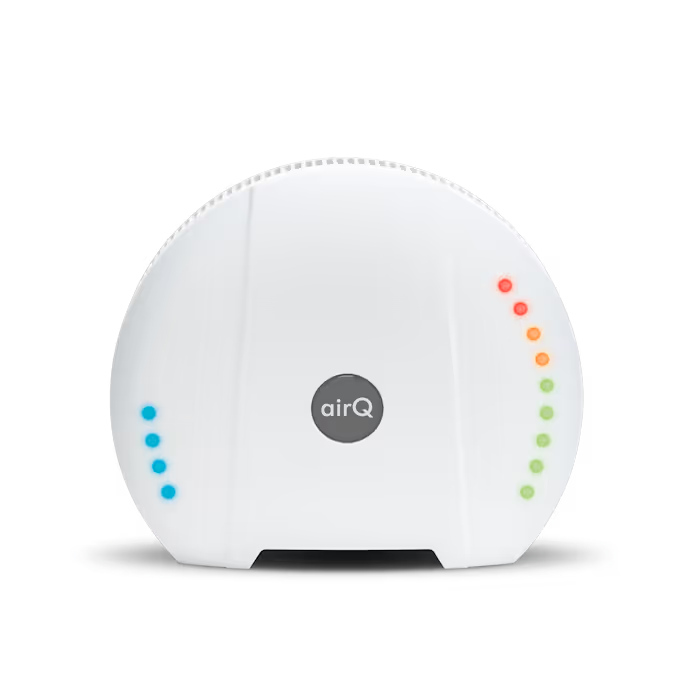
The air-Q offers numerous additional configuration options so you can use your measuring device however you like. With air-Q LED themes, each sensor reading can be displayed via the LEDs on the housing. This lets you see from a distance if something is wrong. There’s also a night mode that adjusts the brightness and Wi-Fi reception. But that’s not all: the app offers many more ways to customize the air-Q.
Video Tour of the air-Q Smartphone App
We've put together a brief overview of some of the features of the air-Q smartphone app.