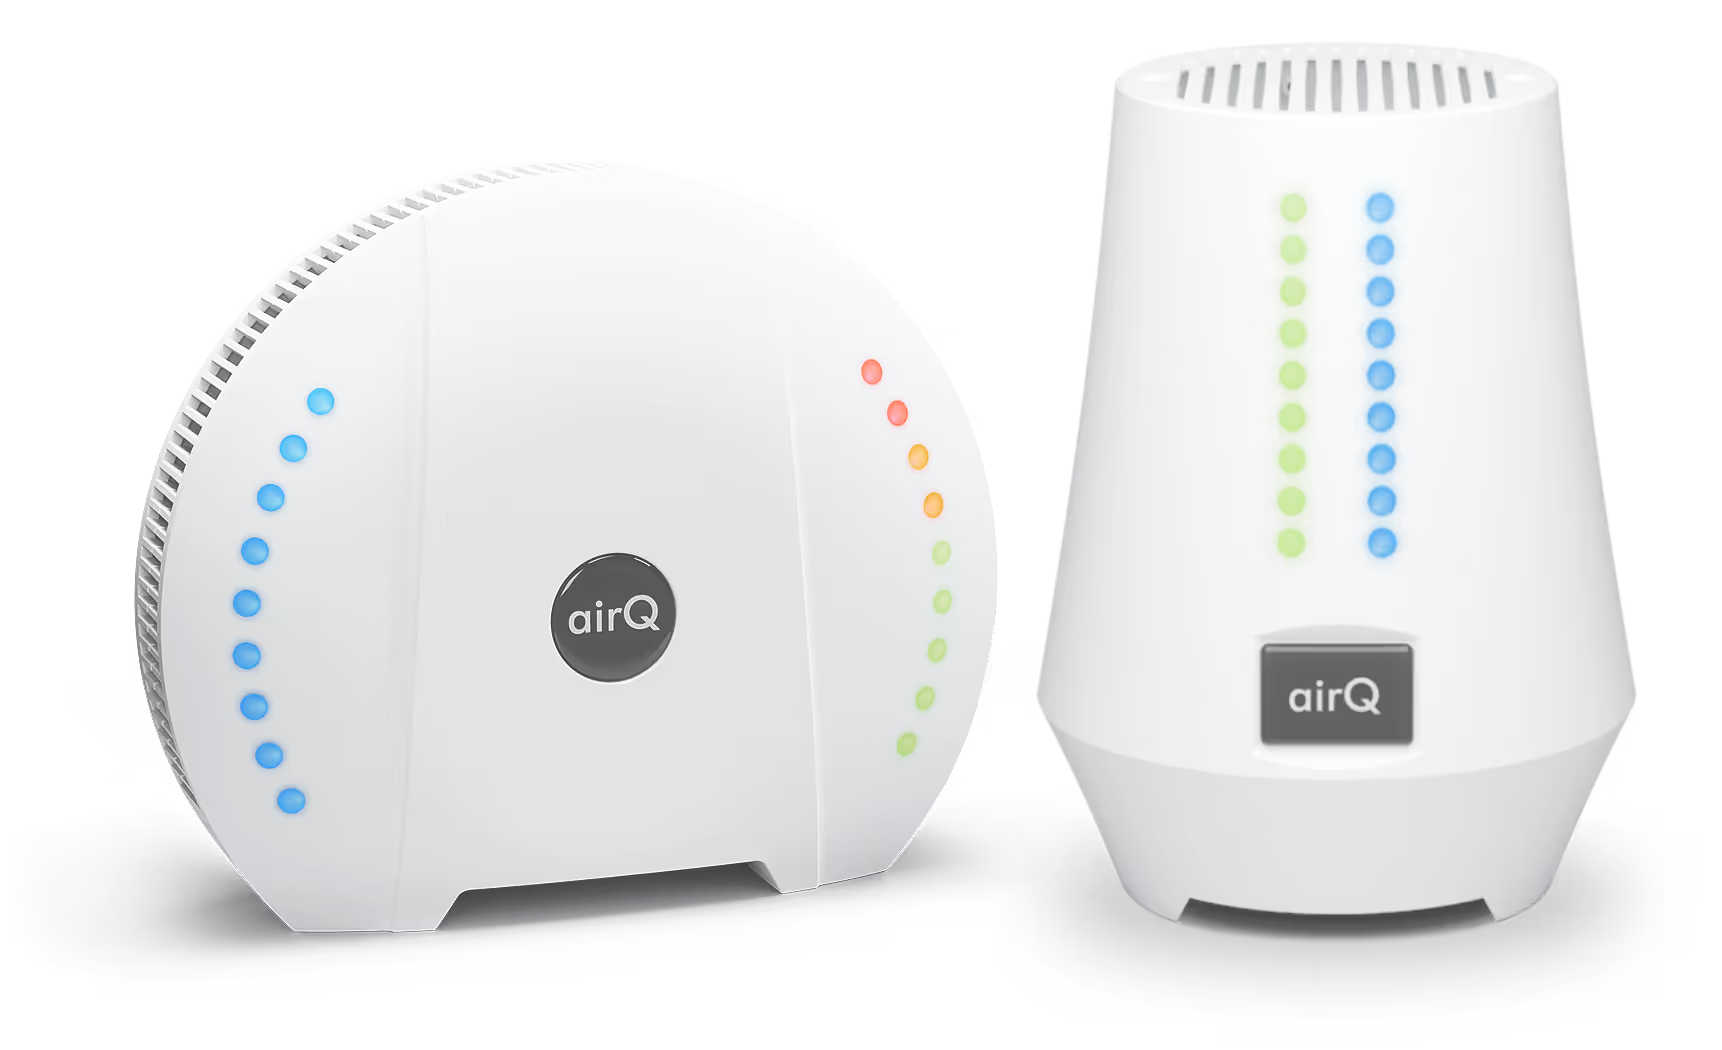
Analyze all sensors and measured values on your PC using the air-Q web app .
With the air-Q Web App, measurement results can be analyzed even more professionally. This allows measured values to be compared across different air-Q devices using graphs and tables. The air-Q Web App truly comes into its own when used with a large number of devices, providing greater clarity.
Go to the air-Q Web App
Access sensors and measurement data even more clearly through your browser—with innovative features
To use the air-Q Web App, you need a free cloud account. In addition, you must enable the optional upload of measurement data to the air-Q Cloud; data is not automatically uploaded to our cloud. The Web App can then be used as a complement to the smartphone app or as a standalone solution for performing advanced air analyses. Thanks to the additional capabilities available on a PC, measurement data can be analyzed with even greater precision. If, for example, you’re using 10 or more air-Q devices, the Web App can provide greater clarity by displaying, among other things, a tabular view of all measurement devices. But that’s by no means all our cloud-based software can do.
The air-Q Web App is free to use.
Overview provided by the panel
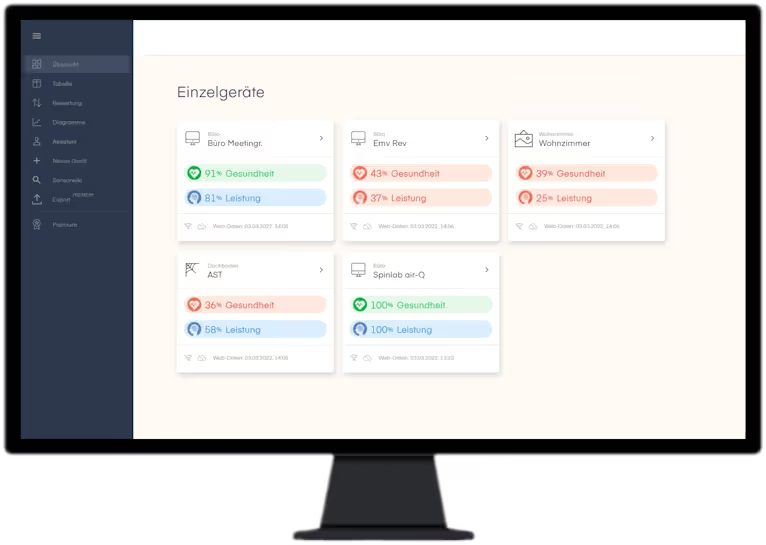
The air-Q Web App dashboard provides a quick overview of all existing air-Q devices. These can also be sorted by category. This ensures that even a very large number of devices remains well-organized and clearly presented. The air-Q health and performance metrics for air quality are immediately visible for all devices.
Tabular presentation of all sensors and measured values
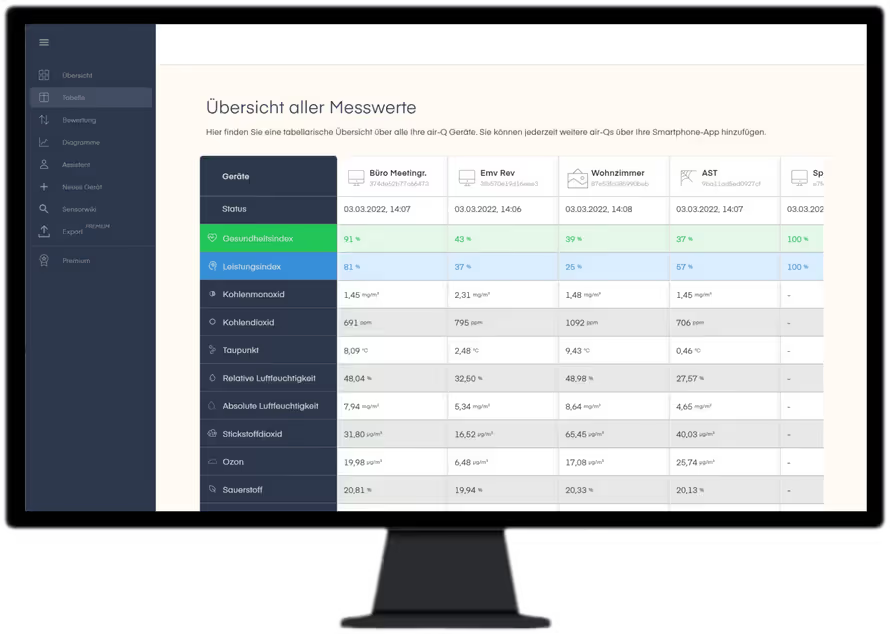
With the air-Q web app, you have access to an informative tabular overview of all sensors and measured values. This allows you to quickly compare all devices and sensors with one another and easily maintain an overview at all times. This view offers significant advantages, especially when using multiple air-Q devices.
Delve Deeper into Sensors
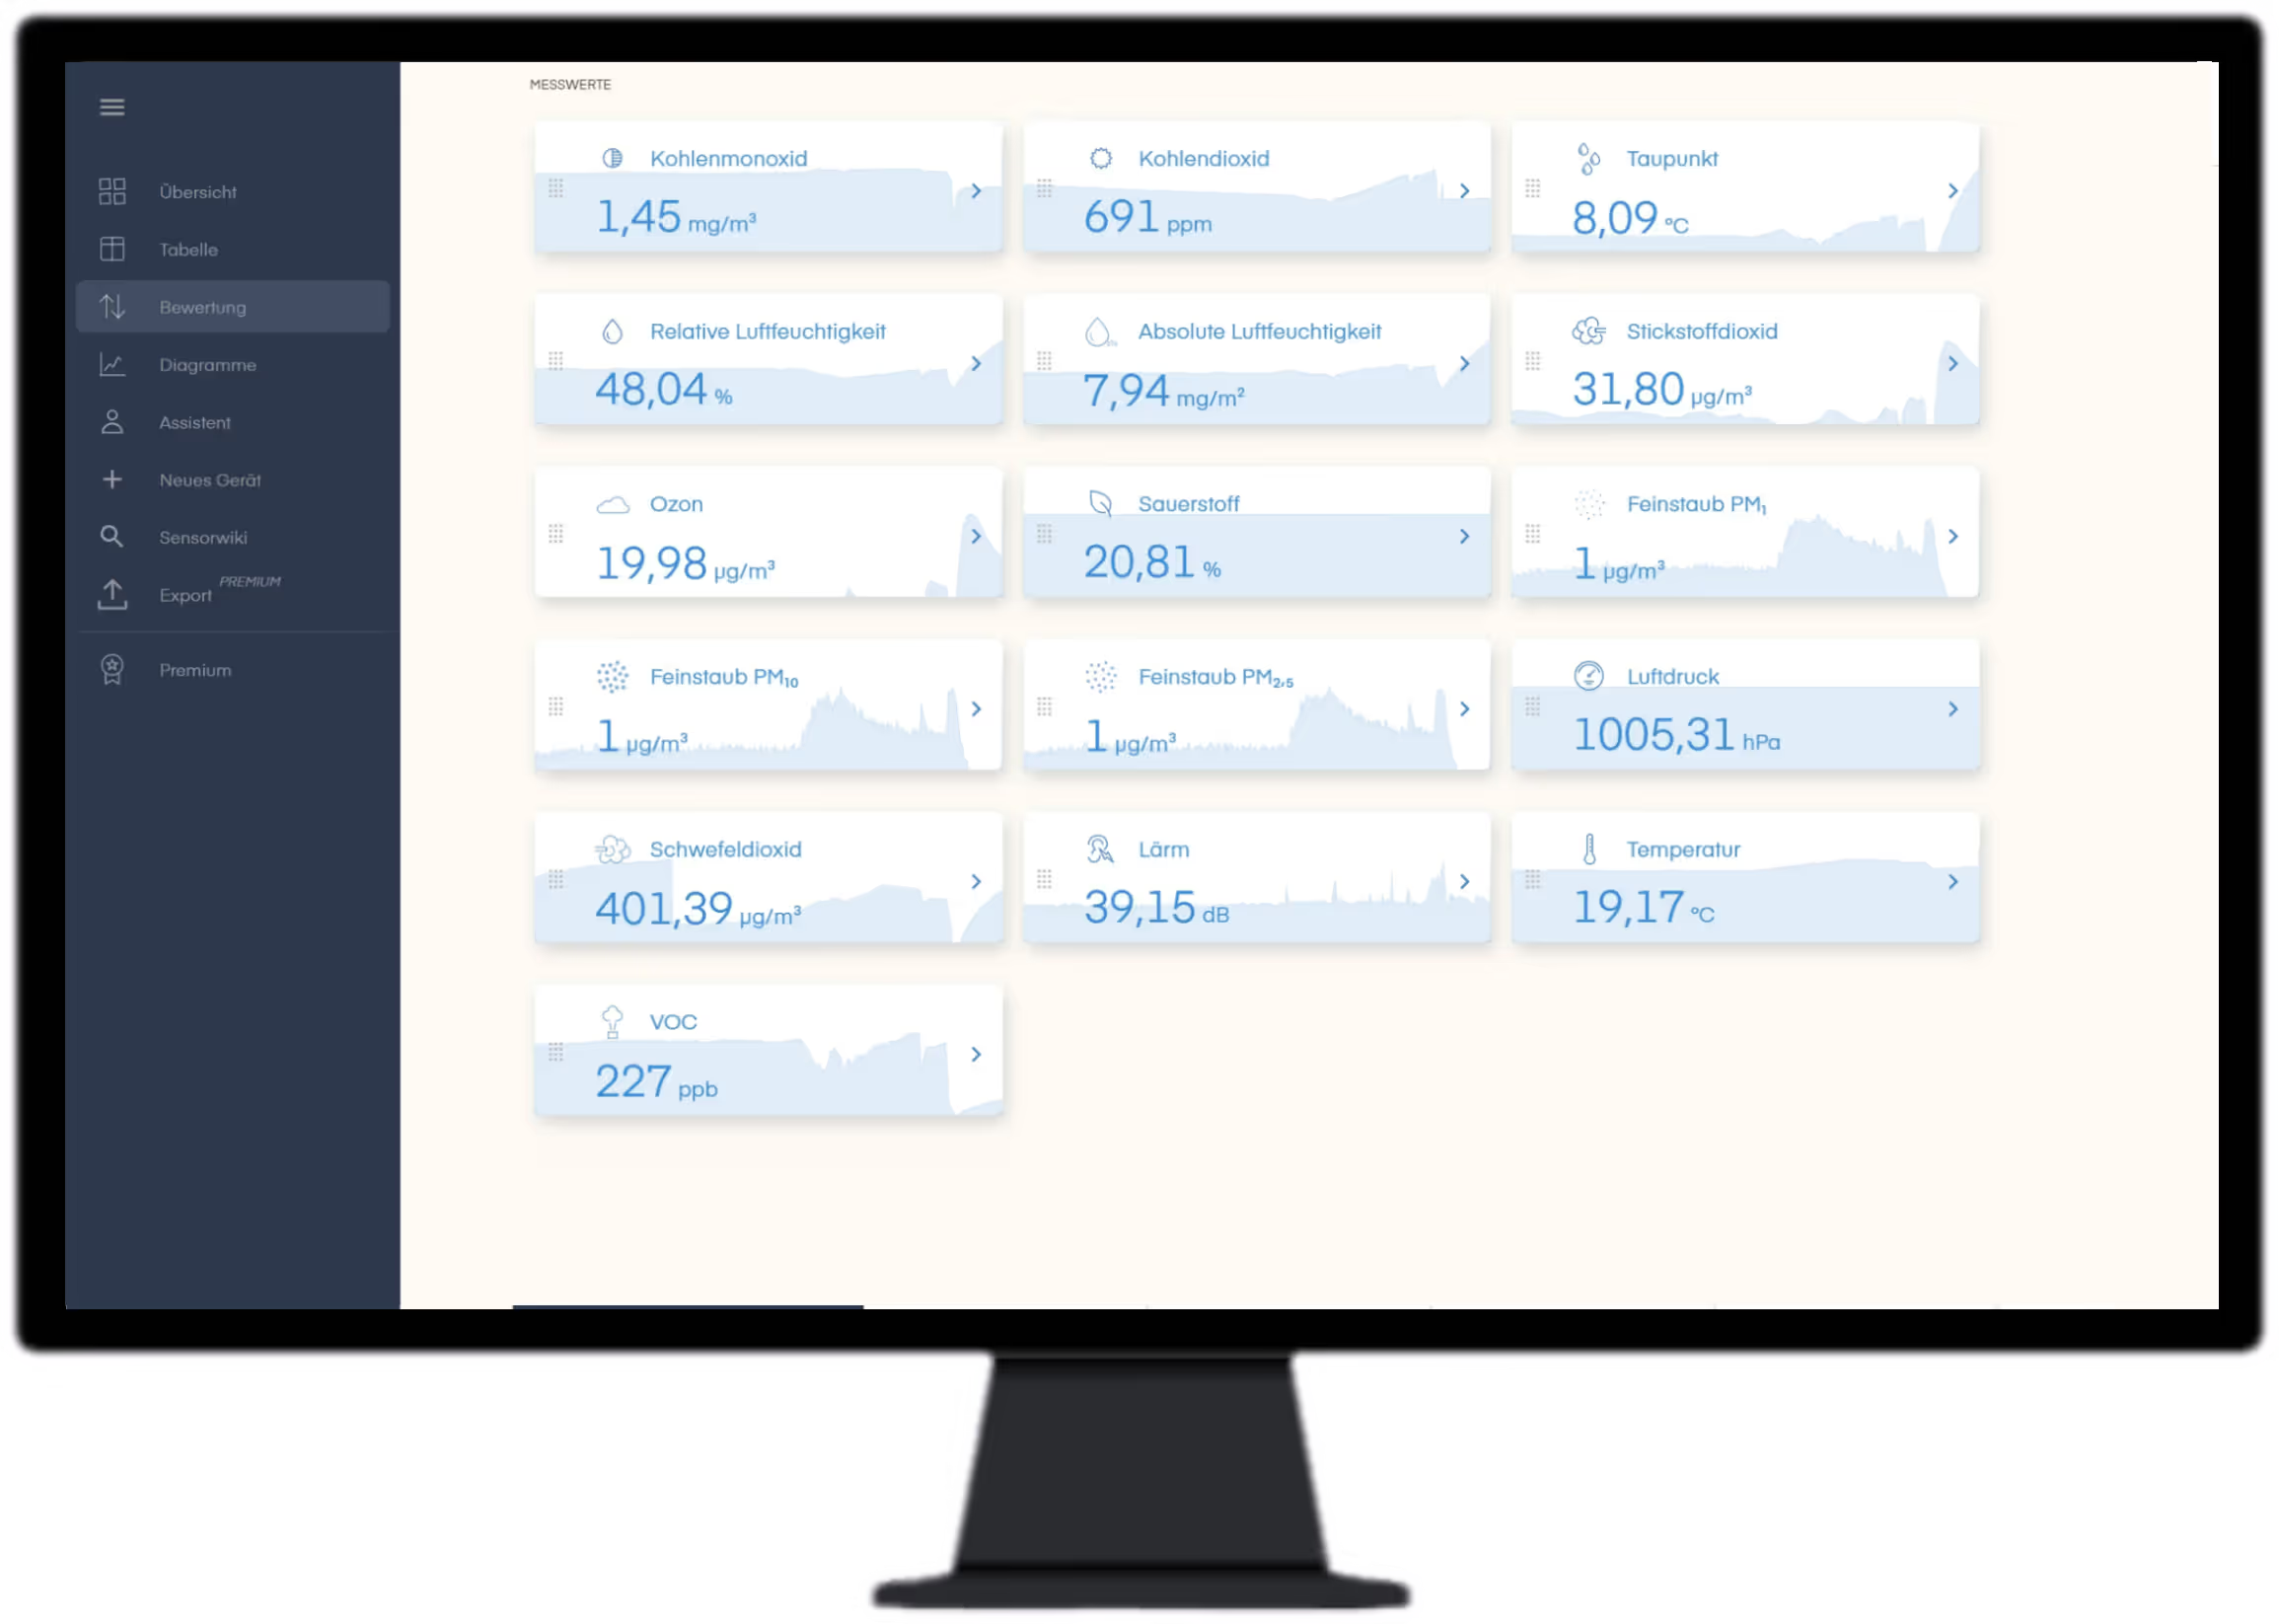
The summary page provides a simple and informative overview of the performance of all sensors, as well as a cumulative health and performance score (the air-Q Health Index™ and Performance Index™). Any values that exceed the thresholds are displayed immediately, and the values are color-coded accordingly. This allows you to see right away if something is wrong somewhere and action is needed.
Display the measured values using Smart Widgets
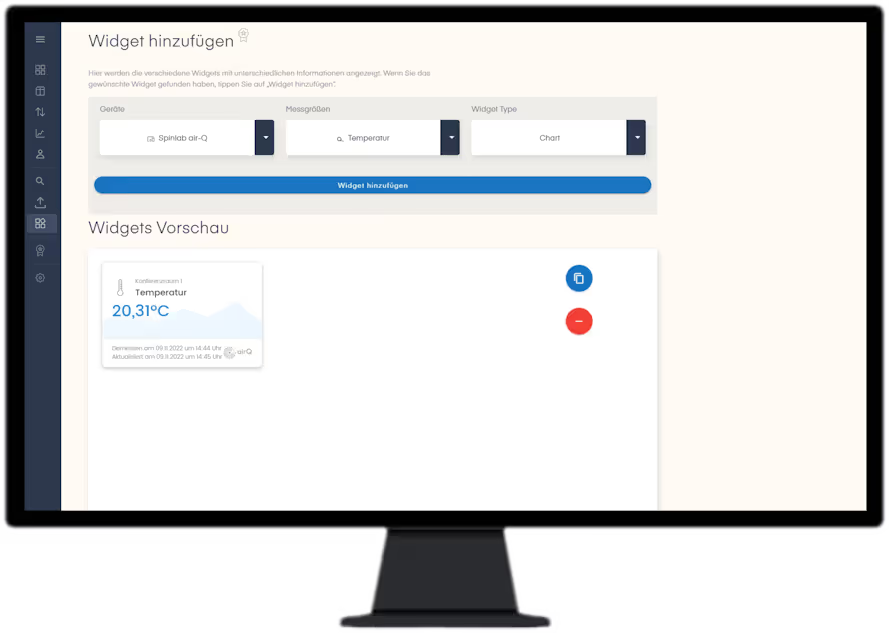
With air-Q Smart Widgets, you can integrate sensor data in the form of small cards displaying measured values into web pages and presentations (such as PowerPoint)—they’re highly versatile and update automatically. Smart Widgets can be created at my.air-q.com. (A premium membership is required for a very large number of Smart Widgets.)
Charts and Comparisons
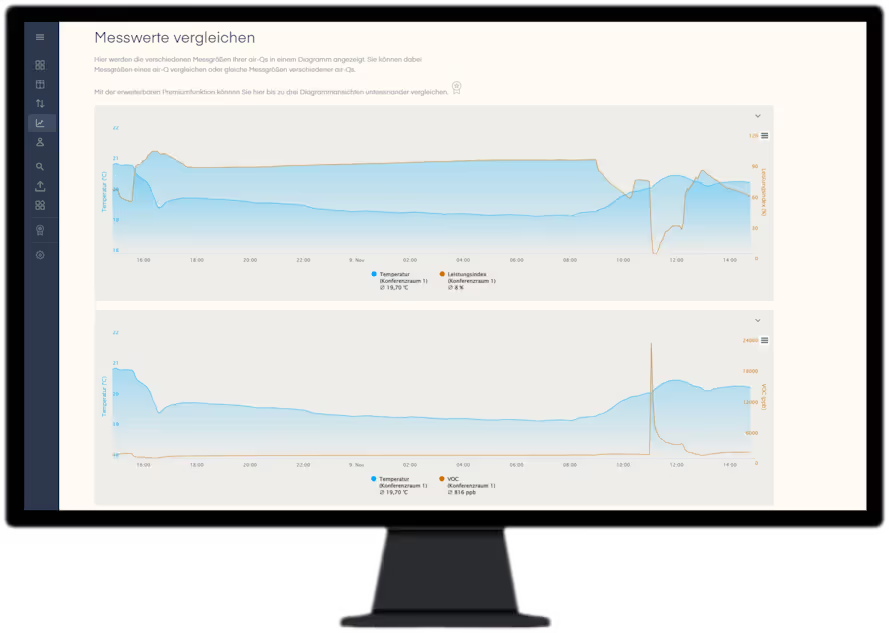
The graphs allow you to compare various sensor readings, even from different air-Q devices. Best of all: thanks to our special graphing module, these comparisons are even more informative and interesting; this way, you can display not only different sensors but also different time periods simultaneously on the graphs. This allows you to detect and analyze even the smallest changes. (A premium membership is required for the “advanced charts” feature, which displays multiple charts in a single view.)
Health and Performance Index
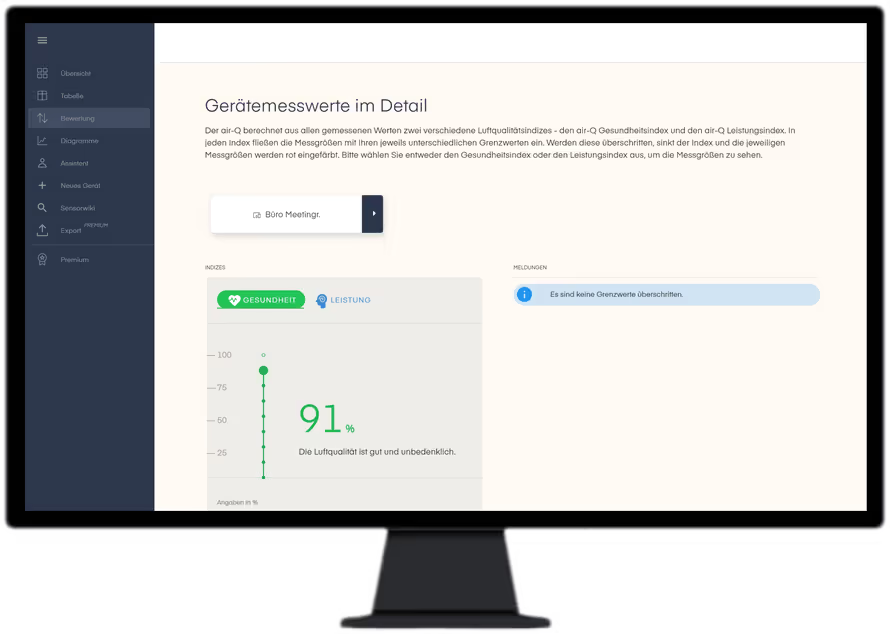
The air-Q health and performance index is also used in the web app to evaluate the large number of measured values. Based on this, the health advisor provides notifications when limit values are exceeded and offers advice on what to do.
Exporting All Data
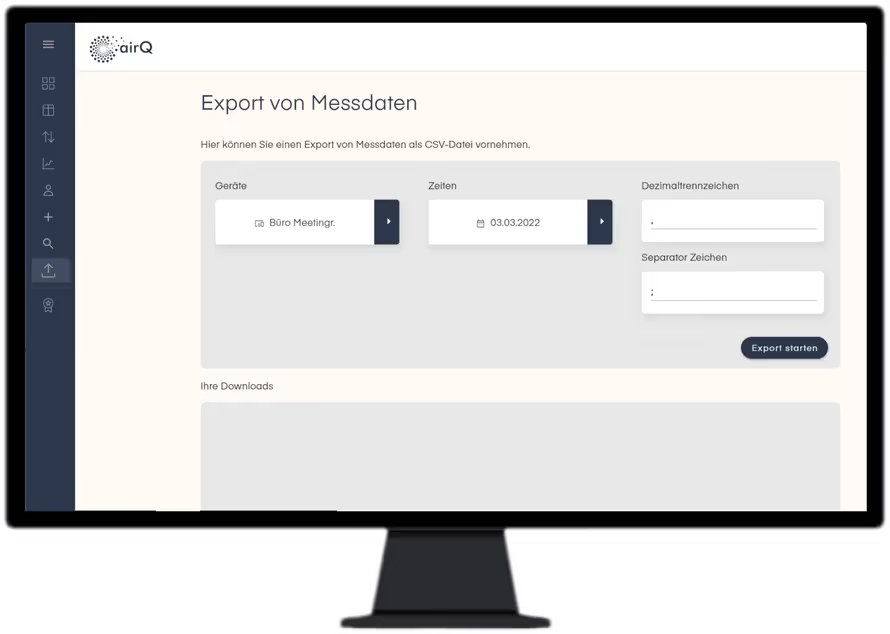
Data export allows you to easily download all measurement data. This data can be downloaded as a CSV file or as a graph. (A premium membership is required to export data via the air-Q Web App.)
Sensor Wiki
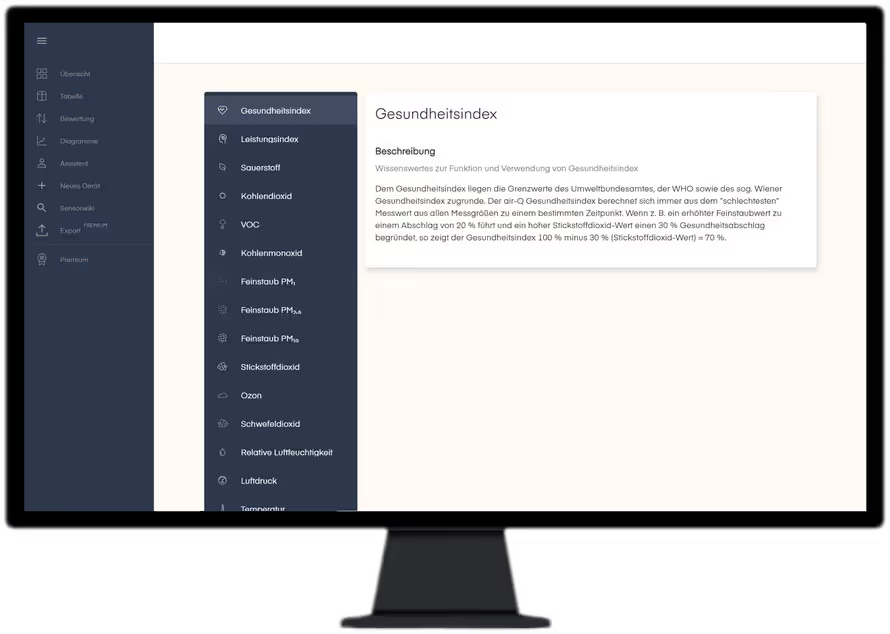
The web app provides a comprehensive overview of all installed sensors and the measured values. You'll learn more about limit values and solutions. It also covers the hardware specifications of the sensors used.
Many more features thanks to updates

We follow a long-term strategy and are constantly working on new and improved features that make our analyses even better and faster. Over the next few weeks, the app and the web app will continue to expand.
Video Tour of the air-Q Web App
We've put together a brief overview of some of the features of the air-Q Web App.