
air-Q — Features for Professional Users
The air-Q measures more parameters than any other air quality device on the market. Whether at home, in the office, or on the production floor—with the free smartphone app and web app, your measurements are always at your fingertips: in real time, clear, and with personalized recommendations for action. For those who want to take it even further, the air-Q’s Premium features offer professional tools for analysis, automation, and integration. Request a free one-month trial now
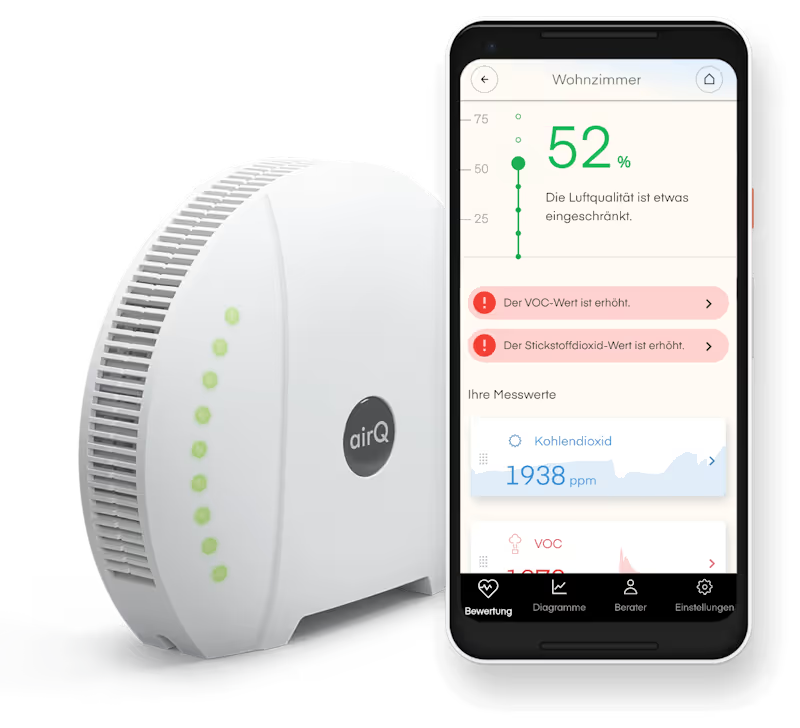
Smartphone apps, web apps, and much more
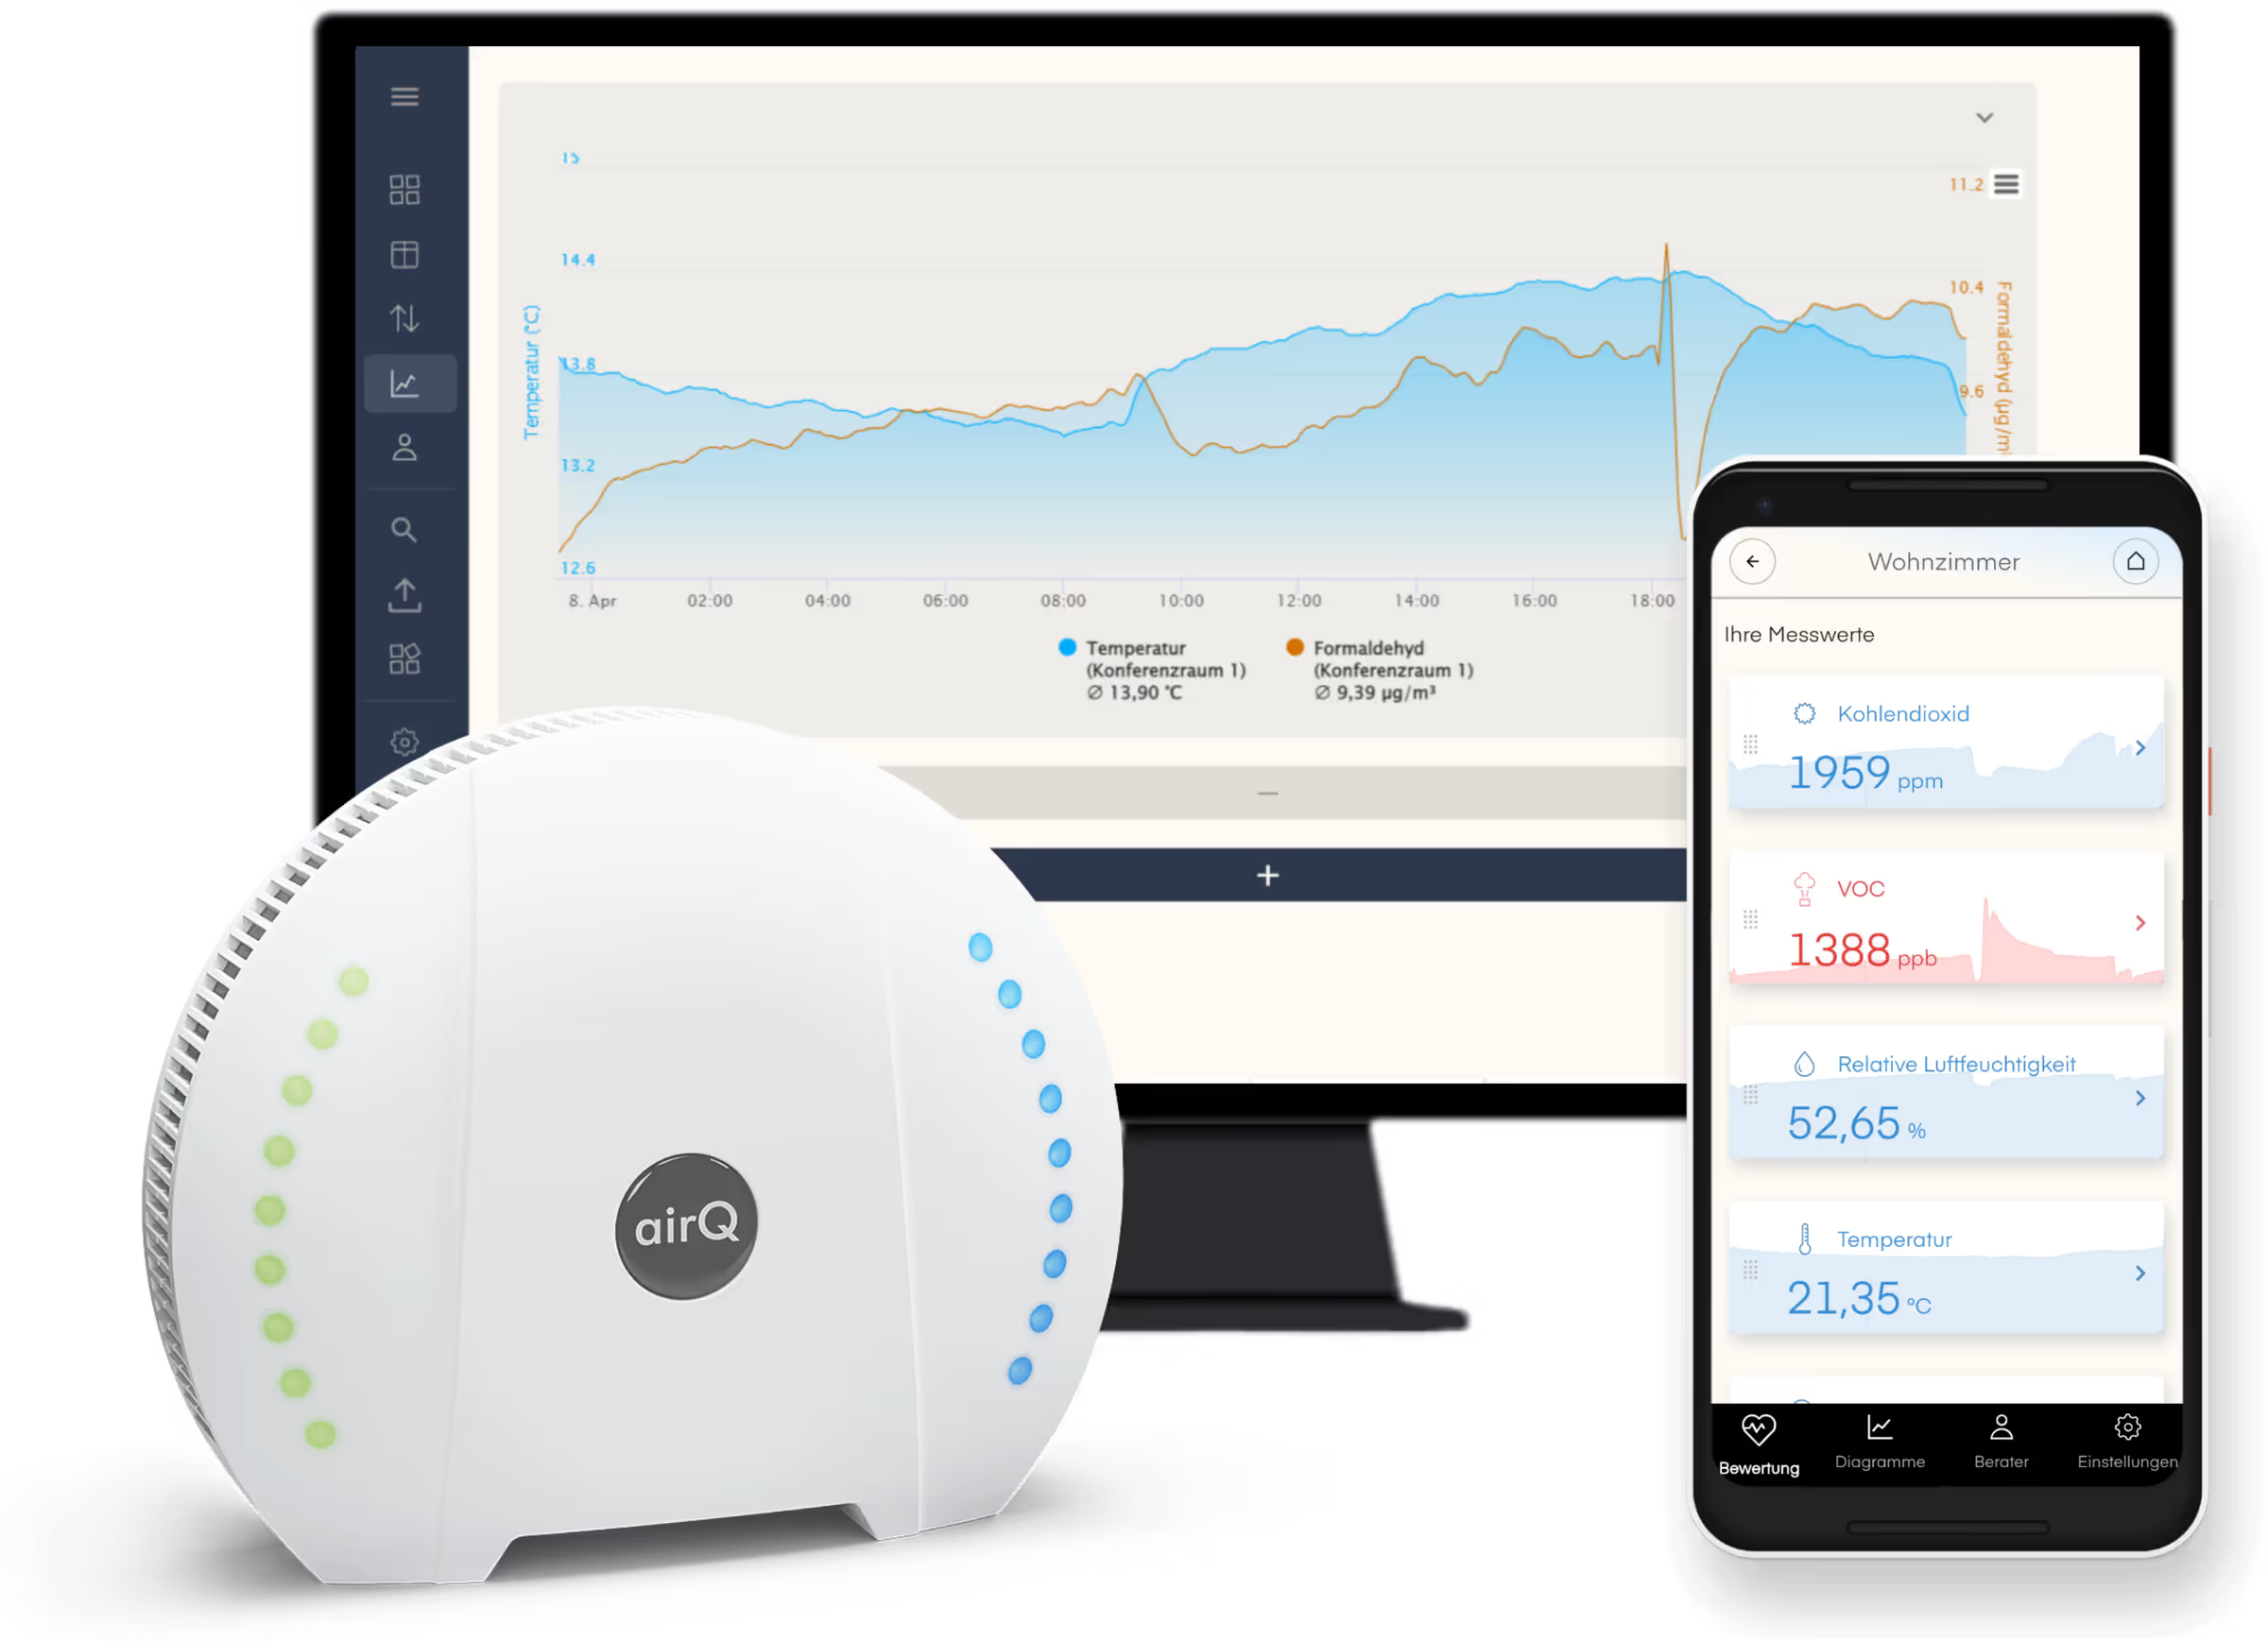
With air-Q, you get the free air-Q smartphone app and the air-Q web app, which provide real-time measurement data, clear graphs and analyses, as well as personalized tips for better air quality.
More Than Just a Measure — Managing Air Quality Professionally
The air-Q already provides you with exceptional measurement data as standard. With Premium features, you take it to the next level: the air-Q’s Premium features are designed for businesses, facility managers, and research institutions that want to not only measure, but also understand and take action: AI-powered analyses, automated reports, advanced data exports, and seamless integration into existing systems—all from a single source.
The air-Q's Premium Features at a Glance

Live Air Quality Data — With and Without an Internet Connection
In addition to real-time data updated every second (no internet connection required), measurement data can optionally be uploaded to the air-Q Cloud. To use this feature, you must create an online account at my.air-q.com and enable data upload on the air-Q—you decide which data is uploaded. With the air-Q Cloud, you can also view measurement data in real time while on the go via the air-Q smartphone app and web app, for an unlimited number of air-Q devices.

Direct connection for mobile use without a router
Using the air-Q smartphone app, you can also get live access to all measured values via a direct connection, without a Wi-Fi router. The measured values are then transmitted in real time from the air-Q to your smartphone via the direct Wi-Fi connection (measurement interval of 2 seconds). This means the air-Q can also be used on the go—no other device offers this capability! Optionally, you can also integrate the air-Q with your mobile hotspot for even more convenient use while traveling.
Compatible with smart homes and smart buildings
L’air-Q supports many smart home standards. We, along with our active community, are constantly developing new integrations and plugins. If the smart home or building standard you’re looking for isn’t available yet, please don’t hesitate to contact us.

Direct local API access to air-Q
air-Q Science devices provide access to the air-Q device API (REST API). Through the API interface, the air-Q can be directly accessed to utilize advanced firmware functions and perform custom settings. Cloud access is not required. Please note: Access to the local API is available only on the air-Q Science and, upon request, for custom device configurations.

Exporting Data from the SD Card
All measurement data is permanently stored on the air-Q’s internal memory card. The measurement data can be downloaded directly from the SD card as JSON files. Our converter allows you to convert the measurement data to CSV.

Air-Q Smart Alarm
With the air-Q, you can set an unlimited number of audible alarms with your own thresholds for each measured parameter. You can also use our preset alarms for fire and gas. In addition, with the air-Q’s smart alarms, you can receive visual, push, and email notifications in the event of a fire, smoke, gas leak, break-in, or system failure—or set your own rules and thresholds.

Events and Notifications (push, email, webhooks)
With advanced events and notifications, an unlimited number of custom thresholds can be defined. When these thresholds are reached, alarms can be triggered or events can be initiated. For example, an unlimited number of actions can be triggered via webhooks (such as controlling a smart plug) when a threshold is reached.

Professional Graphics
With the introduction of two new types of graphs, we’re providing greater clarity for users who have multiple air-Q units and measured parameters. The ability to overlay up to three graphs simultaneously offers professionals even more analytical possibilities. Our new Plenty-Sensors graph also allows scientific users to view all measured values from an air-Q at a glance, making it easier to identify correlations (coming soon).

Personalized AI Advisor for Air Quality
Our new AI air quality advisor (beta) uses artificial intelligence to analyze your air quality data and provide tailored recommendations. It can detect complex patterns in your measured values and use them to generate individualized, actionable recommendations. The assistant is particularly valuable for facility managers and health officials seeking to make data-driven decisions. We also offer the option to generate automatic reports and send them as PDFs. These reports can help establish long-term evidence regarding issues such as radon, mold, noise, and cigarette smoke.

Web API for Custom Cloud Connections
For advanced integration scenarios, we offer a fully documented API. It enables direct connection to your existing systems, such as building management systems, HVAC systems, or business intelligence tools. With the REST API, you can automatically retrieve measured values, control devices remotely, and configure custom alerts.
Flexible Web Data Export
All measurement data is always stored free of charge on the air-Q’s internal memory card in JSON format and can be converted to CSV for further processing. For businesses and research institutions, we also offer advanced export features accessible via the Web App. All measurement data can be easily exported via the Web App in CSV, XLSX, or JSON format, allowing for seamless further processing in statistical software. Data exports can be automated and scheduled according to a set schedule to simplify regular analyses.

Smart Widgets for Displaying Measurement Values
air-Q Smart Widgets allow you to integrate sensor data—in the form of measured values or automatically updated graphs—onto external screens, websites, or presentations, without requiring the viewer to have a user account. A free online account in the air-Q Cloud is required for this.
Widget Dashboards
With air-Q widget dashboards, you can organize important air quality data to suit your needs and view it at a glance. You can choose from a wide variety of widgets, including maps showing real-time measurements, trend charts, and summaries of air quality indices. The dashboards can be customized and configured for different rooms or departments.

Data Storage and Backup
All data in the air-Q Cloud is stored in high resolution for at least one month. All customers with Premium features enjoy unlimited storage capacity and high-resolution storage for measurement data in the air-Q Cloud. This allows you not only to conveniently reuse all historical data at any time, but also to benefit from secure backup and documentation of your measurement data.

Option to integrate your own sensors
As a Premium feature, you can integrate your own external sensors into the air-Q Cloud database and use all of the features available in air-Q. External data sources are treated as “internal” air-Q measured values, with full functionality available in the air-Q smartphone app and web app.
Request Premium Features
During the trial period, all Premium features are available free of charge to individual customers. However, availability cannot yet be guaranteed during the trial period. We would be happy to advise you on our new Premium features.